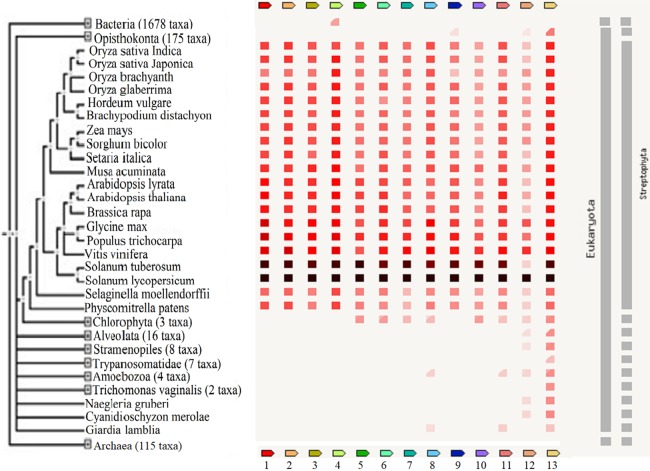
Figure 5. The presence or absence of the transcription factors across various organisms.
Transcription factor occurrence patterns across various genomes. (1) EIL2, (2) EIL3, (3) ZIP, (4) GRAS6, (5) SlERF4, (6) SlERF1, (7) JERF1, (8) WRKY26, (9) ICE1-like, (10) pti6, (11) WRKY11, (12) protein LHY, (13) MYB48. The intensity of the color of the red square reflects the amount of conservation of the homologous protein in the species. White color (No similarity detectable) and black/red color (100 similarity detectable).

