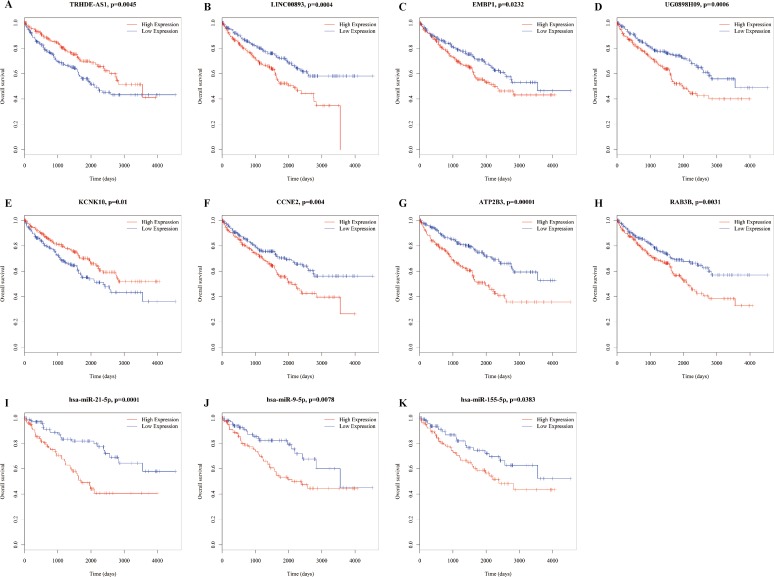
Figure 6. Kaplan–Meier survival curves for 11 related RNAs (4 lncRNAs, 3 miRNAs and 4 mRNAs) in the ceRNA network (horizontal axis: overall survival times: days, vertical axis: survival function).
High expression of LINC00893 (B), EMBP1 (C), UG0898H09 (D), CCNE2 (F), ATP2B3 (G), RAB3B (H), has-miR-21-5p (I), has-miR-5p (J) and has-miR-155-5p (K) is associated with low proportion of overall survival (P = 0.0004, 0.0232, 0.0006, 0.004, 00001, 0.0031,0.0001, 0.0078, 0.0383, respectively); high expression of TRHDE-AS1 (A) and KCNK10 (E) is associated with high proportion of overall survival (P = 0.0045 and 0.001, respectively).

