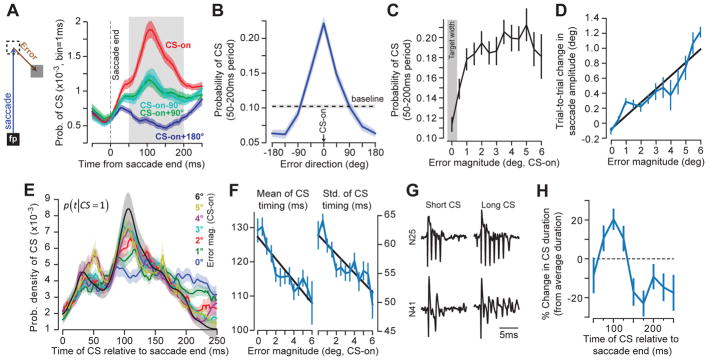
Figure 1. Error direction is encoded in the probability of the CS, whereas error magnitude modulates the distribution of CS timing.
A. While the eyes are gazing at a fixation point (FP), a target is presented (dashed square), and the animal makes a saccade toward it. During the saccade, in some trials the target is displaced to another location (gray square), resulting in a visual error (the vector between eye position at saccade end and the target). Probability of CS across trials was computed for each millisecond of time for each P-cell and for various error directions. CS-on refers to direction of error vector that produced the highest probability of CS. B. Probability of CS in the 50–200ms period following saccade end as a function of error direction. C. Probability of CS in the preferred error direction in the 50–200ms period following saccade end as a function of error magnitude (error direction is CS-on). D. The amount of trial-to-trial behavioral learning as a function of error magnitude. E. Probability density of CS timing for a range of error magnitudes. Bin size is 1ms. Error magnitude modulated the timing distribution, transforming it from a uniform to a unimodal pattern. F. For each P-cell, we computed the probability density of CS timing (over the range 0–250ms following saccade termination) for each error size, and then measured the mean and standard deviation of each distribution. As error magnitude increased, both the mean and standard deviation declined. G. CS waveforms for two representative P-cells. The duration of the CS waveform varied within each P-cell. H. Duration of the CS waveform as a function of when that CS was generated relative to saccade termination. Duration is expressed relative to each P-cell’s mean CS duration. In all cases, error bars indicate between-cell variability via standard error of the mean (SEM) across all cells (n=67).

