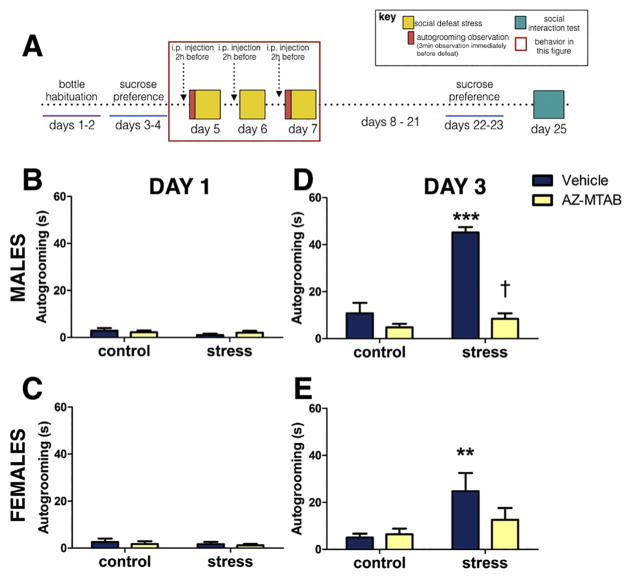
Fig. 2. Autogrooming behavior in male and female California mice in Experiment 2.
Experimental timeline (Fig. 2A). Time spent displaying autogrooming behavior prior to defeat (day 1, Fig. 2B and 2C), and prior to the last episode of defeat (day 3, Fig. 2D and 2E). ***p<0.0001 compared to controls; **p<0.01, main effect of stress; † p<0.0001 compared to vehicle. Group N’s: Males: control/vehicle: 14, control/AZ-MTAB: 14, stress/vehicle: 14, stress/AZ-TAB: 14. Females: control/vehicle: 8, control/AZ-MTAB: 8, stress/vehicle: 8, stress/AZ-MTAB: 8. All error bars are SEM.

