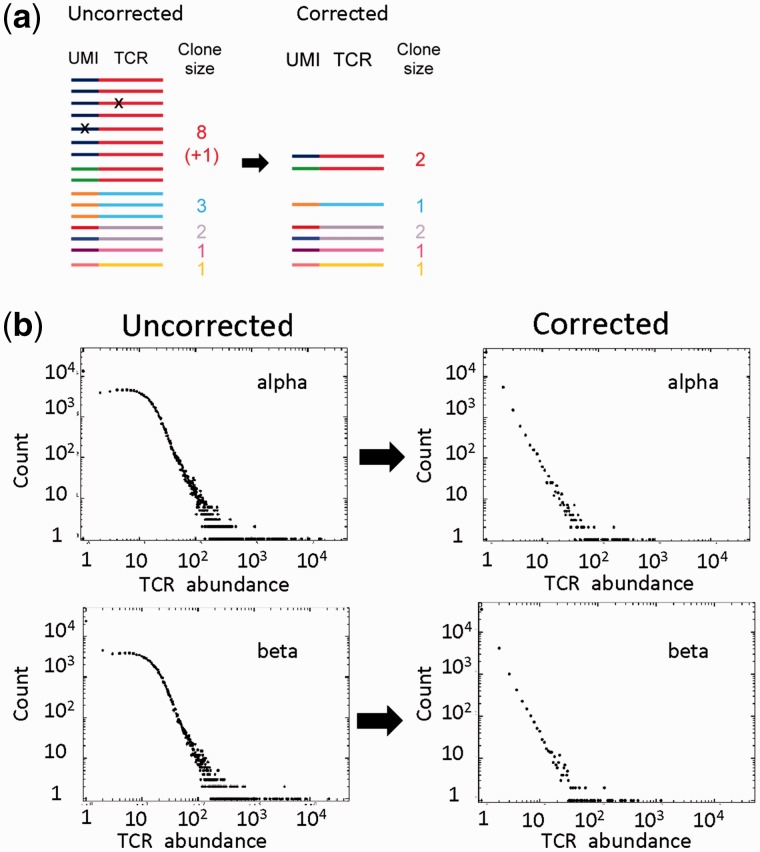
Figure 3.
Error correction using UMIs. (A) Schematic of the error-correction process. Each TCR is associated with a UMI, which acts as a molecular barcode. TCRs are clustered based on UMI. Identical TCRs within a cluster (i.e. with the same molecular barcode) are collapsed to a count of 1. Minority variants within a cluster are similarly merged with the majority variant. The number of clusters (i.e. same TCR, different UMI) gives the corrected abundance count for that TCR. Optionally, barcodes within a specified molecular distance of each other (usually 1 or 2 Hamming units) can be clustered together. (B) The effects of error correction on sequence abundance data for a set of TCR alpha and beta sequences obtained from a sample of unfractionated peripheral blood. The number of TCRs with each abundance observed is plotted against the abundance itself (labeled TCR abundance), e.g. the leftmost point represents the number of TCRs that occur only once in the sample, the next point the number that occurs twice, etc. The figure shows the distribution obtained before (left) and after (right) error correction using UMIs.

