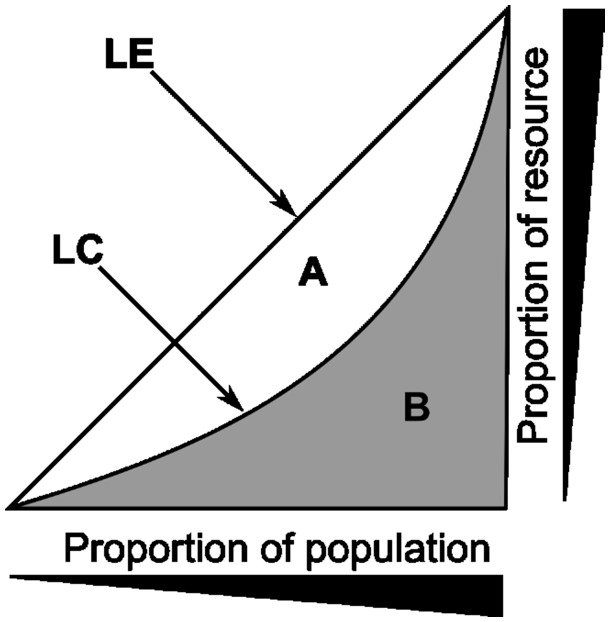
Figure 4.
The Lorenz plot and the Gini index. LE – line of equality; LC – Lorenz curve; the Gini index is defined as the ratio of the areas A/(A + B) (0≤G≤1). Individual members within a population, which in the context of the repertoire is unique TCR sequences, are ranked in order of abundance. The Lorenz curve is obtained by plotting the cumulative abundance of each TCR against its rank (lowest to highest). If all individual species are of equal abundance, the Lorenz curve follows the diagonal, and the Gini index is zero. The more unequal the distribution of abundances, the larger the Gini index (≤1).

