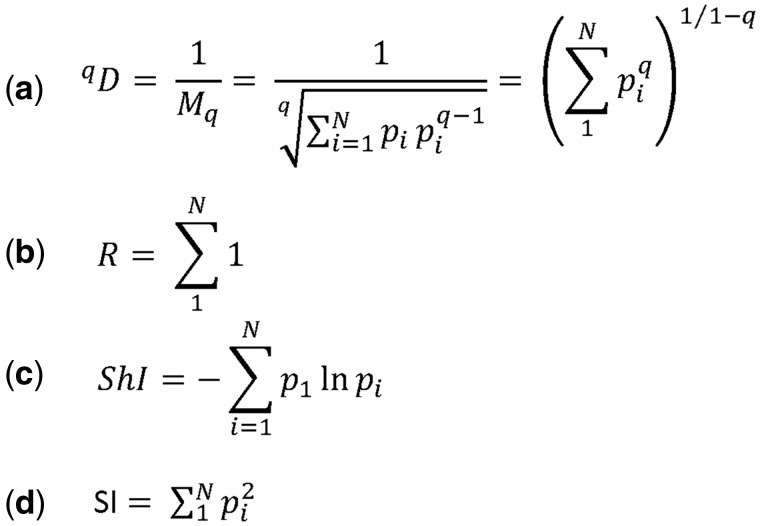
Figure 5.
Measures of diversity. (A) The ‘true diversity’ refers to the number of equally abundant species within a population needed for the average proportional abundance of the species to equal that observed (where all species may not be equally abundant). It is calculated as the inverse of the weighted generalized mean of order q of the proportion (p) of each species within a population of size N. (B) The richness (R) is the number of distinct species observed. It is equivalent to ‘true diversity’ of order 0. (C) Shannon diversity index (ShI, often referred to as the Shannon Entropy) is the logarithm of the ‘true diversity’, as q → 1. (D) The Simpsons diversity index (SI) is the inverse of the ‘true diversity’ of order 2.

