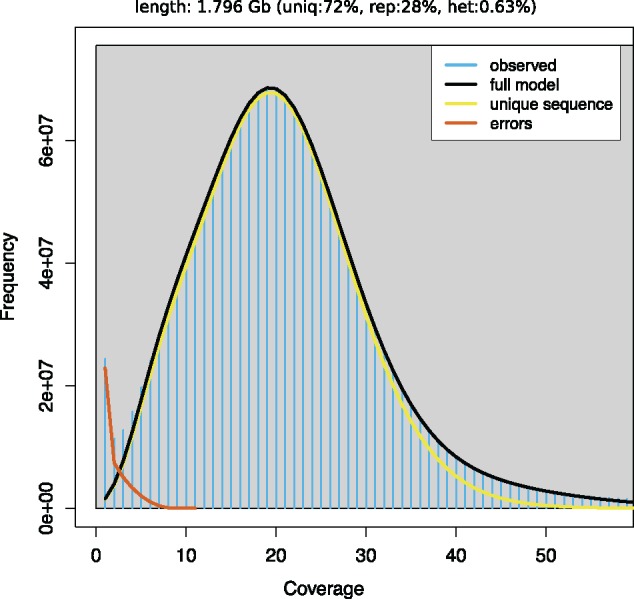
Fig. 1.

—k-mer distribution (k = 21) as calculated by genomescope (Vurture et al. 2017). Blue bars represent the observed k-mer distribution; black line represents the modelled distribution without the error k-mers (red line) and up to a maximum k-mer coverage specified in the model (yellow line). Length, estimated genome length; Uniq, unique portion of the genome (nonrepetitive elements); Rep, repetitive portion of the genome; Het, genome heterozygosity.
