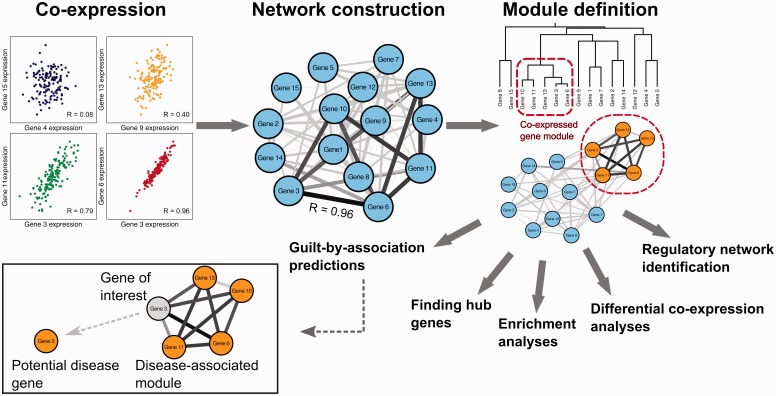
Figure 1.
Example of a co-expression network analysis. First, pairwise correlation is determined for each possible gene pair in the expression data. These pairwise correlations can then be represented as a network. Modules within these networks are defined using clustering analysis. The network and modules can be interrogated to identify regulators, functional enrichment and hub genes. Differential co-expression analysis can be used to identify modules that behave differently under different conditions. Potential disease genes can be identified using a guilt-by-association (GBA) approach that highlights genes that are co-expressed with multiple disease genes.

