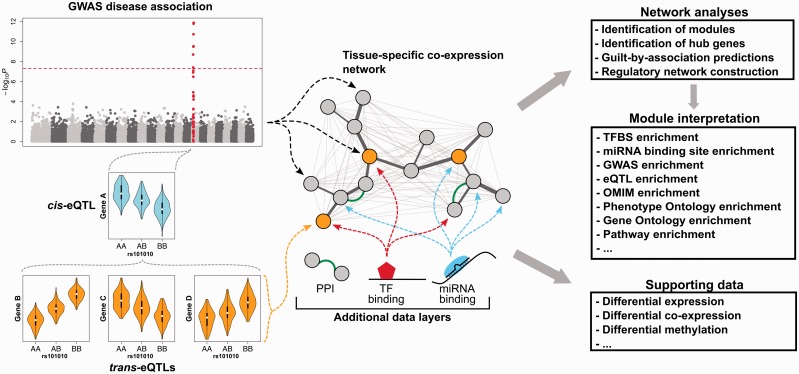
Figure 4.
Strategies for integrating multi-omics data with co-expression analyses. Networks are more informative if they are constructed using expression data specific to the tissue of interest. Genomic variation can be mapped to a co-expression network either by linking suggestive GWAS hits to the genes in the network or by first identifying genetic variants with an effect on gene expression levels (cis- and trans-eQTLs) and then mapping those to the co-expression network. Additional data layers may include TFBSs (based on binding motifs or ChIP-seq/ChIP-chip experiments), miRNA target binding sites (based on in silico predictions or experimental techniques) and established protein–protein interactions. A co-expression network can be used to identify modules, hub genes and for predicting the function of unknown trait-associated genes. Identified modules can be analysed by enrichment analyses to identify overlaying features. Additionally, the research hypothesis can be supported by additional differential expression, co-expression and methylation analyses that can be performed if respective omics data are available for cases and controls for a corresponding trait. eQTL: expression quantitative trait loci; GWAS: genome-wide association study; OMIM: online Mendelian inheritance in man; miRNA: microRNA; PPI: protein–protein interaction; TF: transcription factor; TFBS: TF binding site.

