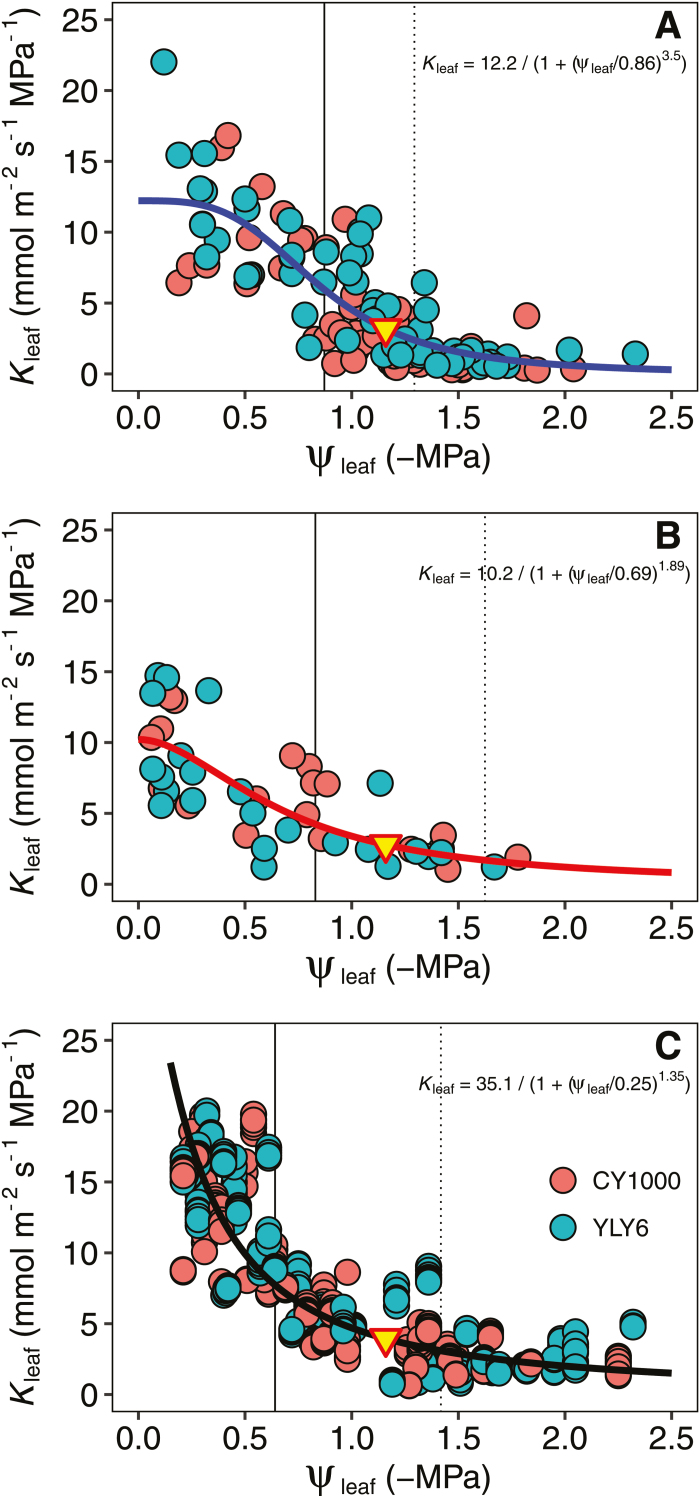
Fig. 3.
Vulnerability of leaf hydraulic conductance (Kleaf) estimated by (A) the standard evaporative flux method (EFM), (B) the rehydration kinetic method, and (C) the gas exchange based EFM method. The vertical solid and dotted lines indicate the water potentials at 50% and 80% loss of Kleaf, respectively. The triangle represents the turgor loss point (Table 1). Fitted lines are the best-fit functions selected using maximum likelihood.

