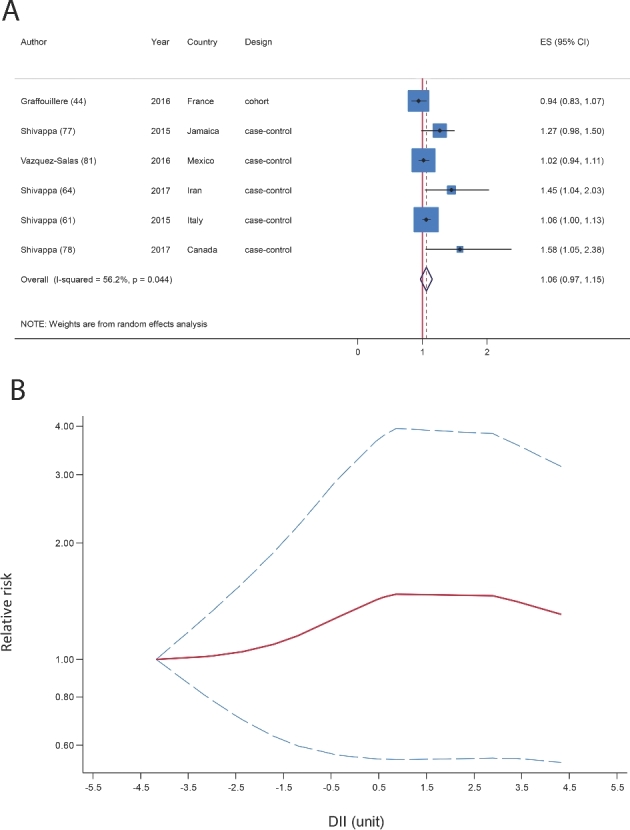
FIGURE 4.

(A) Summary risk estimates for the association between a 1-unit increment in the DII and risk of prostate cancer. (B) Dose-response associations between the DII and risk of prostate cancer. P-nonlinearity = 0.04. The solid lines and dashed lines represent RRs and 95% CIs, respectively. DII, Dietary Inflammatory Index; ES, effect size.
