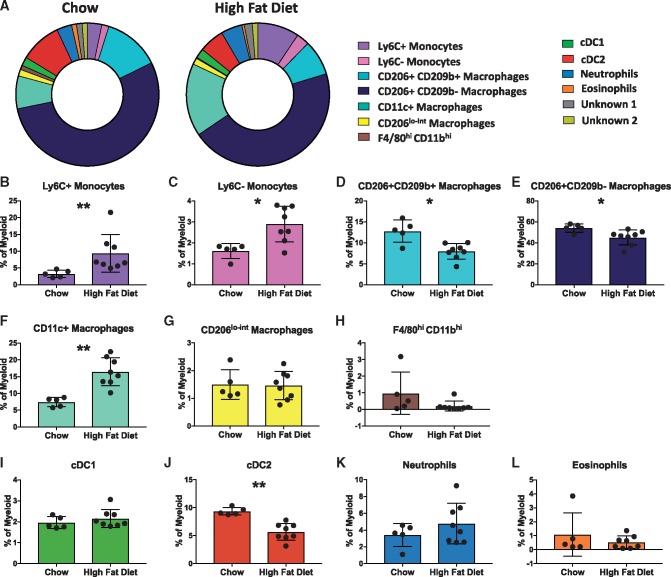
Figure 4.
High fat feeding reshapes the myeloid cell composition of murine atherosclerotic aortas. (A) Doughnut plots show the proportions of the 13 myeloid cell populations from the viSNE analysis in the aortas of chow and high fat diet fed ApoE−/− mice. (B–L) Bar graphs showing the changes in abundance of the cell populations identified in the viSNE clustering outlined in Figure 3, between chow and high fat diet fed mice: Ly6C+ monocytes (B), Ly6C− monocytes (C), CD206+ CD169+CD209b+ macrophages (D), CD206+CD169+CD209b− macrophages (E), CD11c+ macrophages (F), CD206lo-int macrophages (G), F4/80hi CD11bhi macrophages (H), conventional type 1 dendritic cells (cDC1) (I), conventional type 2 dendritic cells (cDC2) (J), neutrophils (K), and eosinophils (L). Data are presented as mean± SD. Dots represent individual samples, n = 5–8 *P < 0.05, **P < 0.01.

