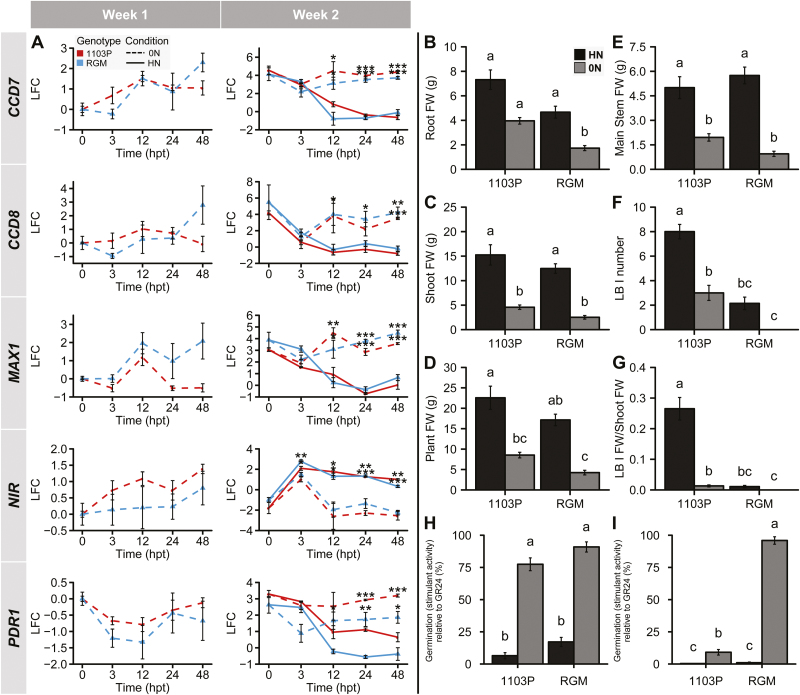
Fig. 4.
Responses to N availability of RGM and 1103P grown as cuttings in hydroponic culture. (A) Transcript levels of SL-related and NIR genes in roots of 1103P (red) and RGM (blue) cuttings during weeks 1 and 2 of N treatment. Dashed lines represent samples from 0N plants and solid lines correspond to HN resupplied plants. Relative normalized expression values are represented as log2 fold change (LFC) relative to the beginning of the treatment (0 hpt, week 1). Data are presented as means ±SE, n=3 individual plants. Asterisks represent significant differences between 0N and HN conditions for each genotype using Student’s t-test: *P<0.05, **P<0.01, ***P<0.001. (B–G) Fresh weights of different plant organs measured after 35 d of N treatments. Lateral branches (LB) fresh weight per shoot fresh weight (G) were calculated. Data are presented as means ±SE, n=15 individual plants. Letters above the bars indicate significant differences between treatments (i.e. condition × genotype) using a multiple comparison test after Kruskal-Wallis (P<0.05). (H) Germination-stimulant activities of root exudates diluted 1:2. Exudates were collected during the second week of culture from group 1 and group 2 plants. Activities are presented as a percentage relative to the positive control GR24. Data are presented as means ±SE, n=20 (exudates from five individual plants repeated four times). (I) The same root exudates samples were diluted 1:10 and re-plated. Letters indicate significant differences between treatments (i.e. condition × genotype) using a Tukey’s test (P<0.05).

