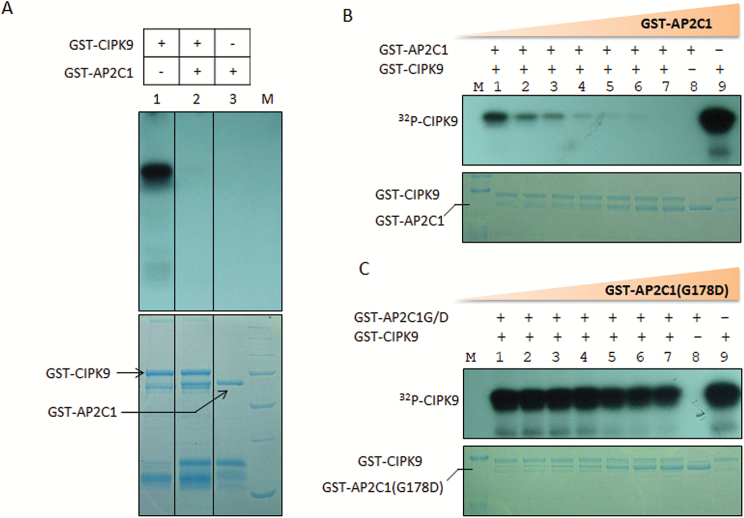
Fig. 4.
Dephosphorylation of auto-phosphorylated CIPK9 by AP2C1. (A) Autoradiogram showing detection of signals after adding different combination of GST-CIPK9 and GST- AP2C1 proteins. Lanes of interest were sliced from same autoradiogram/gel and placed together for easy representation of the data. Each sliced part is clearly demarcated by border lines. (B) To determine the dose-dependent activity of AP2C1, the concentration of GST-AP2C1 was increased gradually from 0–250 ng while GST-CIPK9 was kept constant at 500 ng in all the reactions. The autoradiogram shows the gradual decrease in the auto-phosphorylation signal of CIPK9. (C) A gradual increase in the concentration of GST-AP2C1 (G178D) from 0–250 ng did not affect the phosphorylation level of auto-phosphorylated GST-CIPK9. The presence or absence of each protein in the reaction mixture is shown as + or –, respectively.

