Fig. 6.
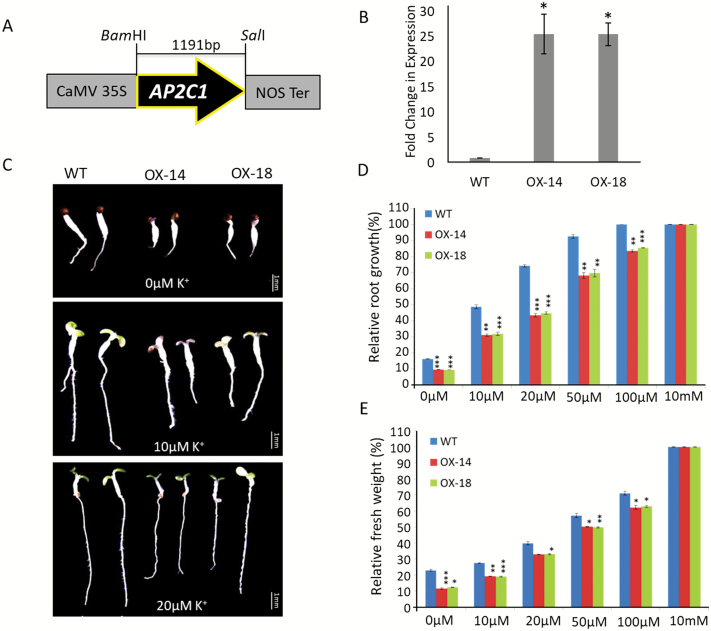
Phenotypes of transgenic AP2C1-overexpression lines on K+-deficient media. (A) Schematic representation of the construct used for overexpression of AP2C1 in Arabidopsis. (B) qPCR analysis of two AP2C1-overexpression lines (OX-14 and OX-18) confirming ~25-fold higher expression than the wild-type (WT, Col-0). The data are means (±SE) of three replicates. * P<0.05 for OX lines relative to the WT. (C) Growth of the WT, OX-14, and OX-18 on low-K+ concentrations after 7 d. Scale bars are 1 mm. (D) Root growth of seedlings after 7 d with different K+ concentrations. The data show root growth relative to that of the WT at 10 mM K+. (E) Fresh weight of 7-d-old seedlings grown on different K+ concentrations. 20 seedlings of each genotype were used for analysis in three independent experiments (n=3); data are means (±SD). *P<0.05, **P<0.01, ***P<0.005.

