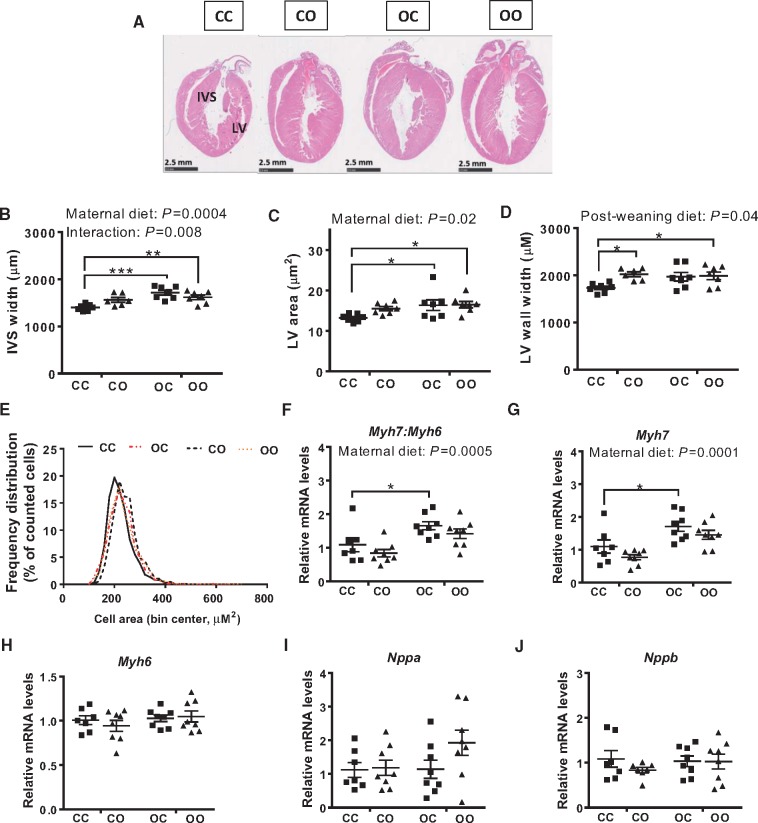
Figure 2.
Exposure to maternal over-nutrition programmes pathological cardiac hypertrophy. (A) Representative H&E staining of mid-cardiac sections; (B) interventricular septum (IVS) width; (C) area of the left ventricle; (D) left ventricular (LV) wall width. N= 6–7 animals from independent litters for each dietary group. (E) Frequency distribution of cardiomyocytes cell area in the left ventricle of CC, OC, CO, and OO 8-week-old animals (in red are groups exposed to maternal obesity; n = 6/dietary group); (F–J) mRNA levels of cardiac hypertrophic markers Myh7: Myh6, Myh7, Myh6, Nppa, and Nppb (n = 7–8). CC, mum fed chow, offspring fed chow; OC, mum fed obesogenic diet, offspring fed chow; CO, mum fed chow, offspring fed obesogenic diet; OO, mum fed obesogenic diet, offspring fed obesogenic diet. Two-way ANOVA followed by Dunnett’s post hoc test for multiple comparisons vs. CC was performed. The overall effect of maternal diet and post-weaning diet is reported where significant in each panel. Significant vs. CC: *P < 0.05, **P < 0.01, ***P < 0.001.

