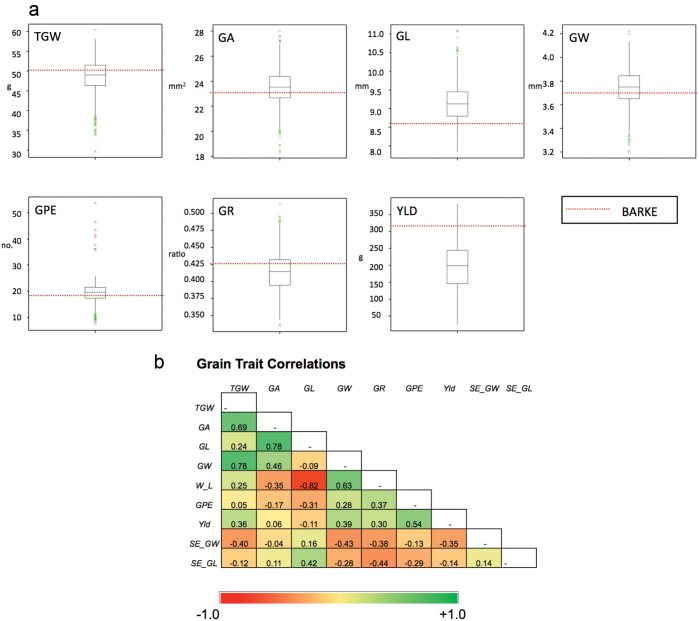
Fig. 1.
Phenotypic distribution of yield traits. (a) The box-plots display yield component traits based on averages over sites, locations, years, and treatments. The dotted red lines indicate the Barke (recurrent parent) trait scores. (b) Pearson’s correlation coefficients between yield component traits based on trait means across treatments, sites, and years. Abbreviations of yield component traits: thousand grain weight ‘TGW’, grain area ‘GA’, grain length ‘GL’, grain width ‘GW’, grain roundness ‘GR’, grains per ear ‘GPE’, ‘YLD’ yield. Green=positive correlation, red=negative correlation.

