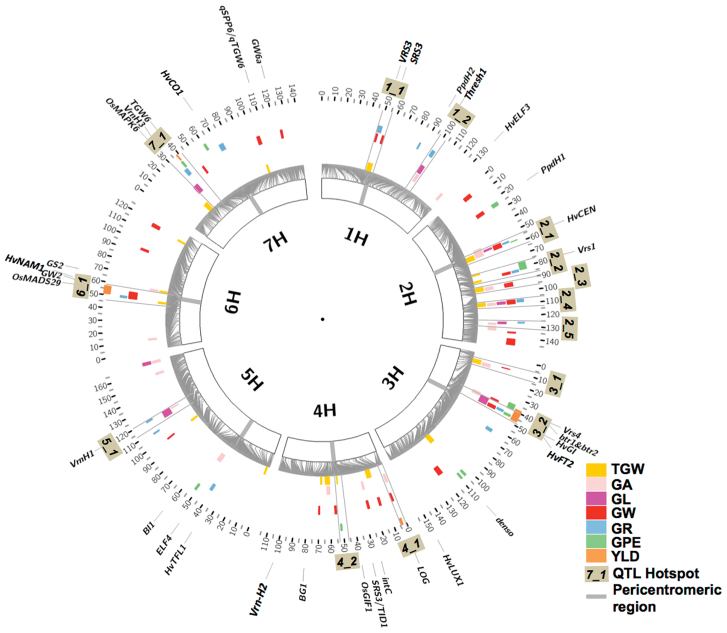
Fig. 2.
Circos graph displaying QTL hotspots for yield-related traits. QTL hotspot intervals, wherein several yield-related traits coincide, are bordered by grey radial lines. Map positions of candidate genes from barley and related cereal species which affect developmental and yield trait effects are also shown.

