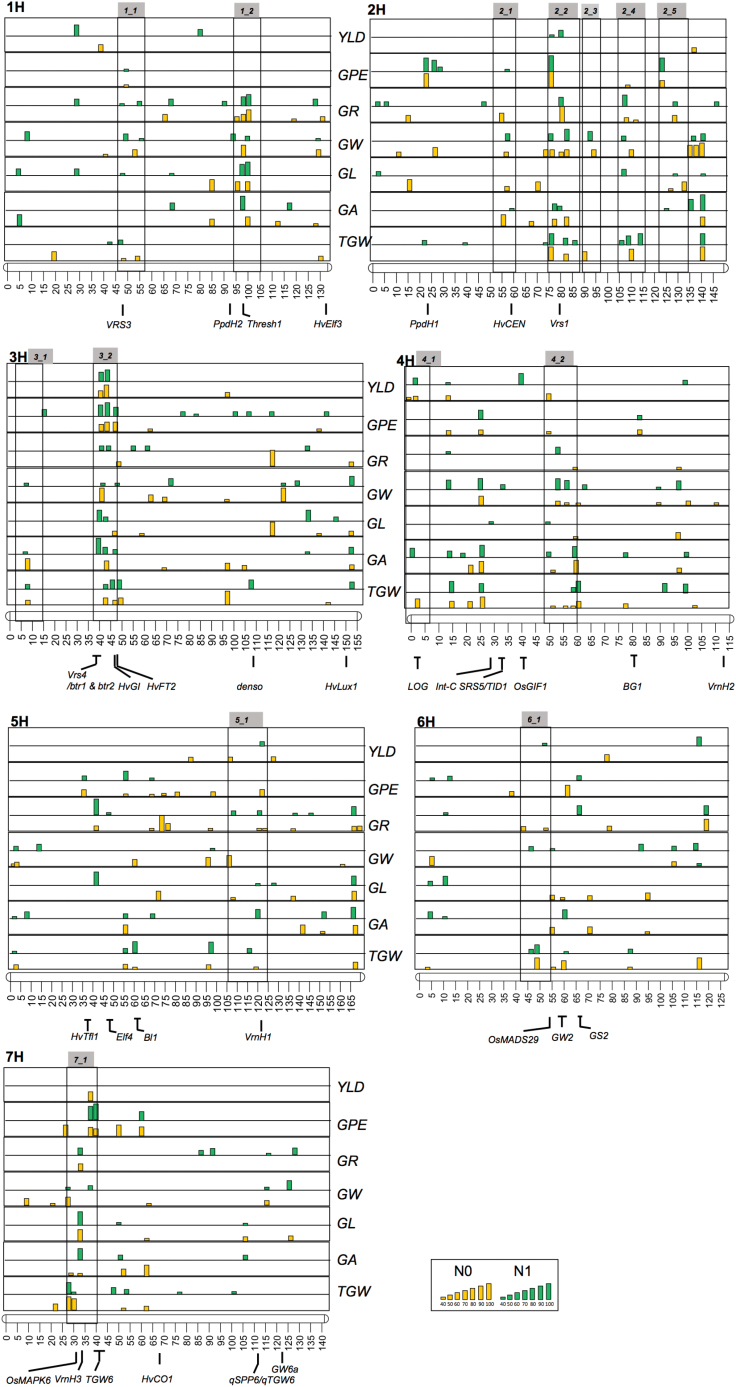
Fig. 3.
Genetic architecture of yield-related traits under varying nitrogen levels. Cross-validations (≥40) are displayed, where the height of the histogram bar corresponds to the number of cross-validations (see the Materials and methods). The highest significant SNPs are projected when multiple SNPs coincide over sites and N treatments (see Supplementary Table S5).

