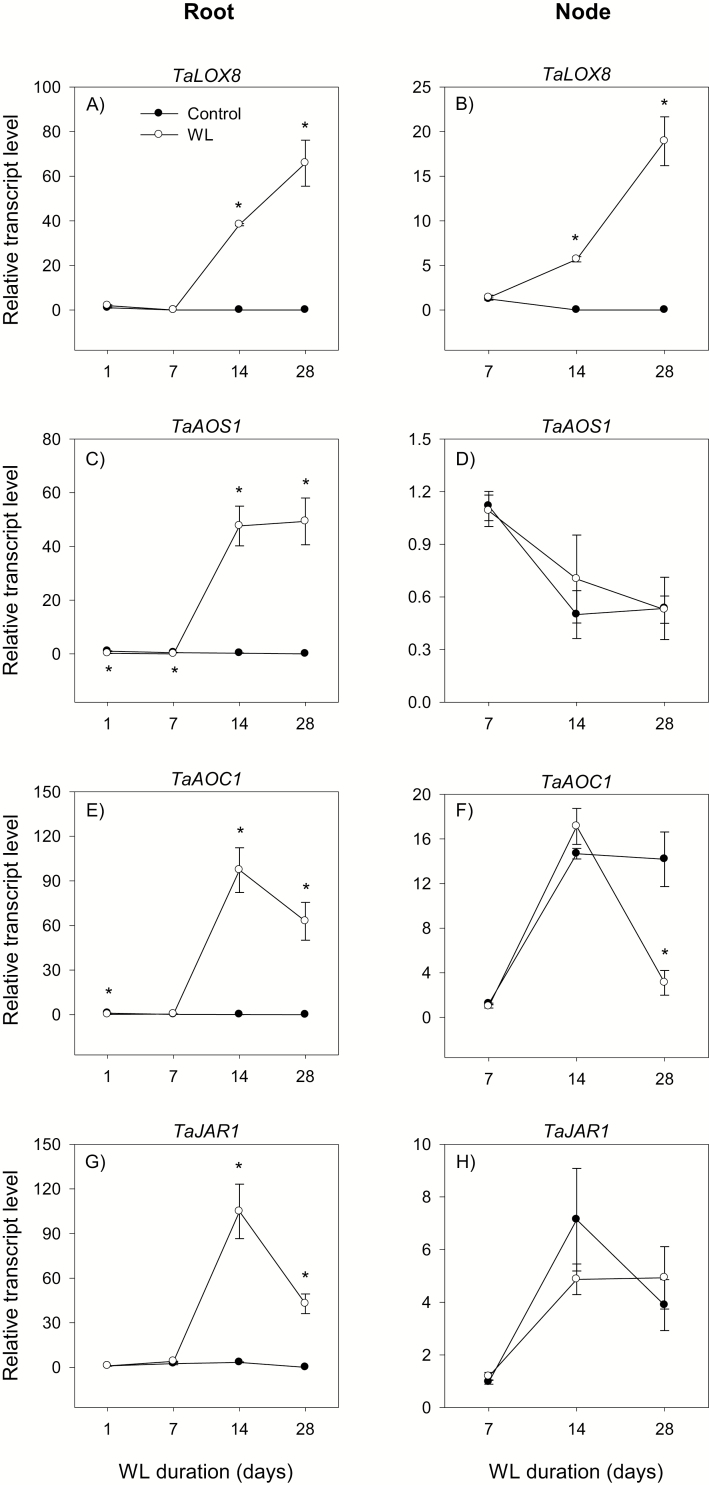
Fig. 8.
Expression of jasmonate metabolism genes. Relative transcript levels of LOX8 (A and B), AOS1 (C and D), AOC1 (E and F), and JAR1 (G and H) in the root tissue waterlogged for 1, 7, 14, and 28 d (A, C, E, and G) and stem node tissue waterlogged for 7, 14, and 28 d (B, D, F, and H), and their respective controls. Transcript levels of each gene in both tissues were determined as described in Fig. 3, and are expressed relative to their respective transcript levels in control roots at 1 d after the start of waterlogging, which were arbitrarily set a value of 1. Other data descriptions are as indicated in Fig. 3. LOX2 in both tissues, AOS2 in the root, and AOC2 in the stem node exhibited either relatively lower levels of expression than their respective homologs or undetectable levels of expression irrespective of growth conditions, as shown in Supplementary Table S3.

