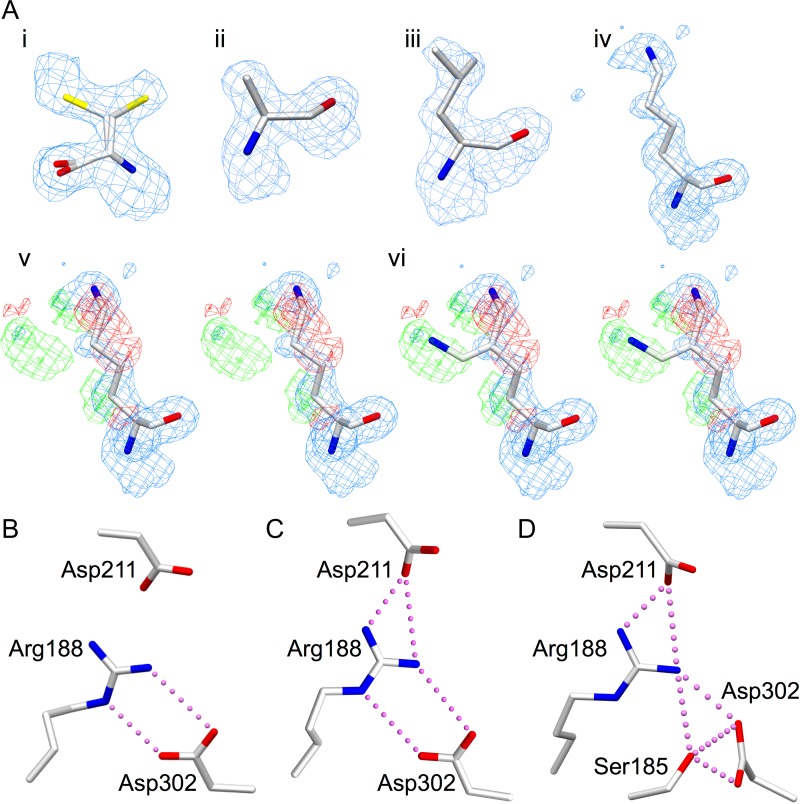
Fig. 3.
(A) Electron density for mutated key active site residues (i) D302C, with the sulfhydryl group modeled in two positions each with 50% occupancy, (ii) D302A, (iii) D302L, (iv) R188K modeled in one conformation, (v) the stereoview of R188K modeled in one conformation with the difference map included and (vi) the stereoview of R188K modeled in two conformations with the same maps as (v) demonstrating the flexibility of the Lys188 side chain. Electron density diagrams are 2Fo−Fc maps contoured at 1.0 σ (blue) and Fo−Fc difference maps contoured at −3.0 (red) and 3.0 σ (green). (B–D) Salt bridge interactions among Ser185, Arg188, Asp211 and Asp302 in (B) unliganded GTB in the open state (PDB code 2RIT), (C) GTB in the liganded intermediate state (conformation #2, PDB code 5C1L) and (D) chimeric enzyme AABB in the liganded closed state (conformation #1, PDB code 2RJ7). Atoms are colored by element with oxygen red, nitrogen blue and sulfur yellow.

