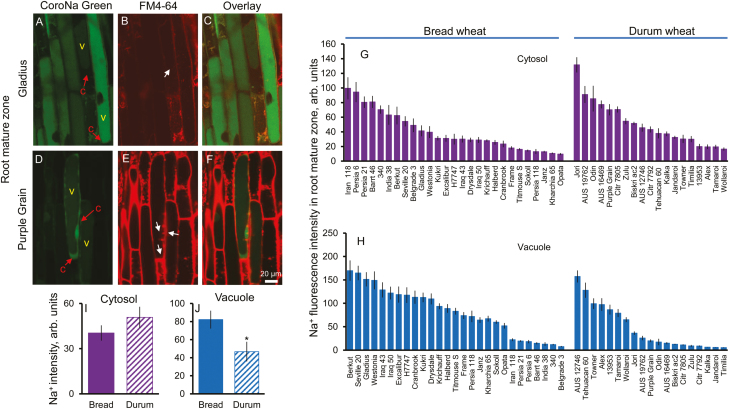
Fig. 3.
Genetic variability of Na+ intensity in the cytosol and vacuole in the root mature zone. (A, B) and (D, E) Representative images of root mature zone cells stained with CoroNa Green dye and FM4-64 membrane dye in bread wheat Gladius (A, B) and durum wheat Purple Grain (D, E) cultivars. (C and F) The corresponding overlay images. c, cytosol, v, vacuole. (G and H) Na+ content in the cytosolic (G) and vacuolar (H) compartments in the root mature zone of 46 wheat varieties contrasting in their salinity tolerance quantified by the intensity of CoroNa Green fluorescence (arbitrary units). Mean ±SE (n=72–96 cells from at least six individual plants). (I and J) Averaged pooled values for Na+ intensity in the cytosol (I) and vacuole (J) in the root mature zone for bread and durum wheat clusters. Mean ±SE [n=19 (durum wheat) and 27 (bread wheat)]. *Significant at P<0.05. Hydroponically grown 4-day-old wheat seedlings were treated with 100 mM NaCl for 72 h.

