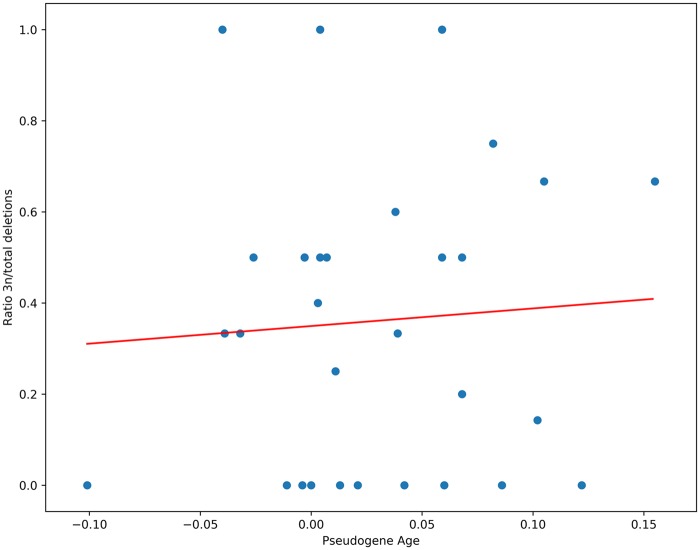
Fig. 3.
—Ratio of 3n deletions to total deletions as a function of estimated pseudogene age in Ca. B. pumila. Pseudogene age is the time elapsed since the first inactivating mutation, giving rise to the pseudogene. The trend line shown was fitted using linear regression analysis (Pearson correlation coefficient and P-value were 0.065 and 0.73, respectively) on 30 pseudogenes. The total number of deletions per pseudogene ranges from 3 to 10. Details of the pseudogene age calculation are given in supplementary information, Supplementary Material online.

