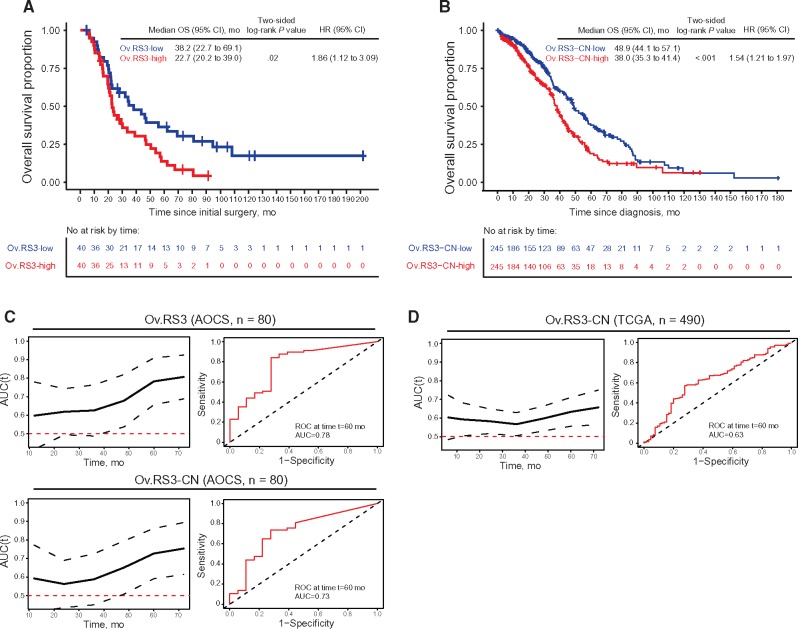
Figure 4.
Overall survival and Ov.RS3. A) Kaplan-Meier analysis of overall survival in the Australian Ovarian Cancer Study (AOCS) cohort stratified by Ov.RS3 contribution relative to the median. B) Kaplan-Meier analysis of overall survival in the TCGA cohort stratified by Ov.RS3-CN similarity relative to the median. C) Time-dependent area under the receiver operating characteristic (ROC) curve for Ov.RS3 and Ov.RS3-CN applied to the AOCS cohort, including representative ROC curve for overall survival at 60 months. D) Time-dependent area under the ROC curve for Ov.RS3-CN applied to the TCGA cohort, including representative ROC curve for overall survival at 60 months. Comparisons were performed using a two-sided log-rank test, and HRs were estimated using univariate Cox regression. Dotted lines on the time-dependent area under the ROC curve plots represent 95% confidence interval for estimates. AOCS = Australian Ovarian Cancer Study; AUC = area under the receiver operating characteristic curve; CI = confidence interval; HR = hazard ratio; OS = overall survival; ROC = receiver operating characteristic; TCGA = The Cancer Genome Atlas.

