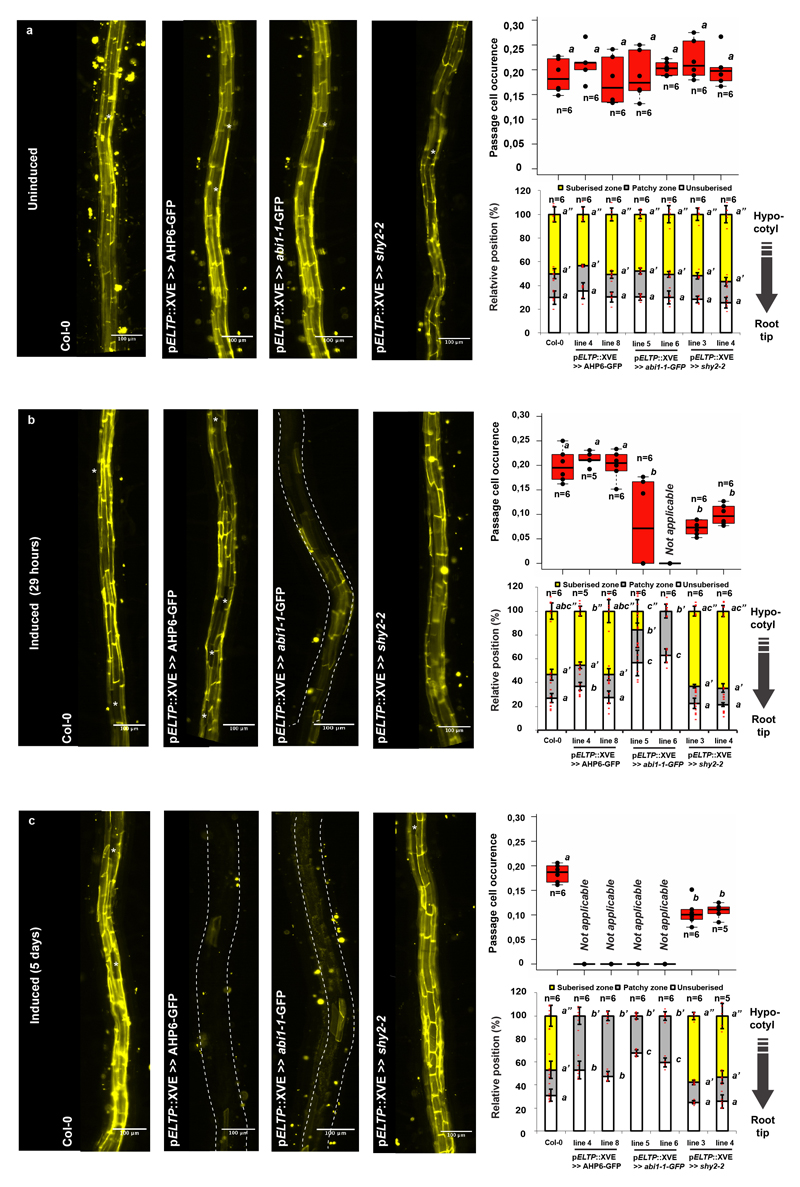
Extended Data Figure 6. Temporal control of suberin inhibition.
Expression of temporally controlled dominant inhibitors of cytokinin (AHP6-GFP), ABA (abi1-1-GFP) or auxin (shy2-2) signaling in the differentiated endodermis using an estradiol inducible system (XVE)19. a-c) Fluorol Yellow staining (left) and quantification of passage cells (top right) and suberin (bottom right) in the late endodermis of plants grown on ½ MS media containing DMSO for 5 days a), plants grown for 4 days on ½ MS media containing DMSO then transferred to 5 μM estradiol for 29 hours b) or germinated for 5 days on ½ MS media plates containing 5 μM estradiol c). nd; not detected. Asterisks indicate passage cells. All dots represent individual datapoints. Notice that for all stacked graphs there are 3 measurements per root (unsuberised zone (white), patchy zone (grey) and suberised zone (yellow)). n represent biologically independent samples. Bar graphs represent mean ± SD, boxplot centers show median. Individual letters show significantly different groups according to a post hoc Bonferroni-adjusted paired two-sided T-test. For more information on data plots see the statistics and reproducibility section. Images in a) - c) are representative of 9 independent lines. All stainings were repeated 3 times. n represents independent biological samples. Scale bars represent 100 μm.

