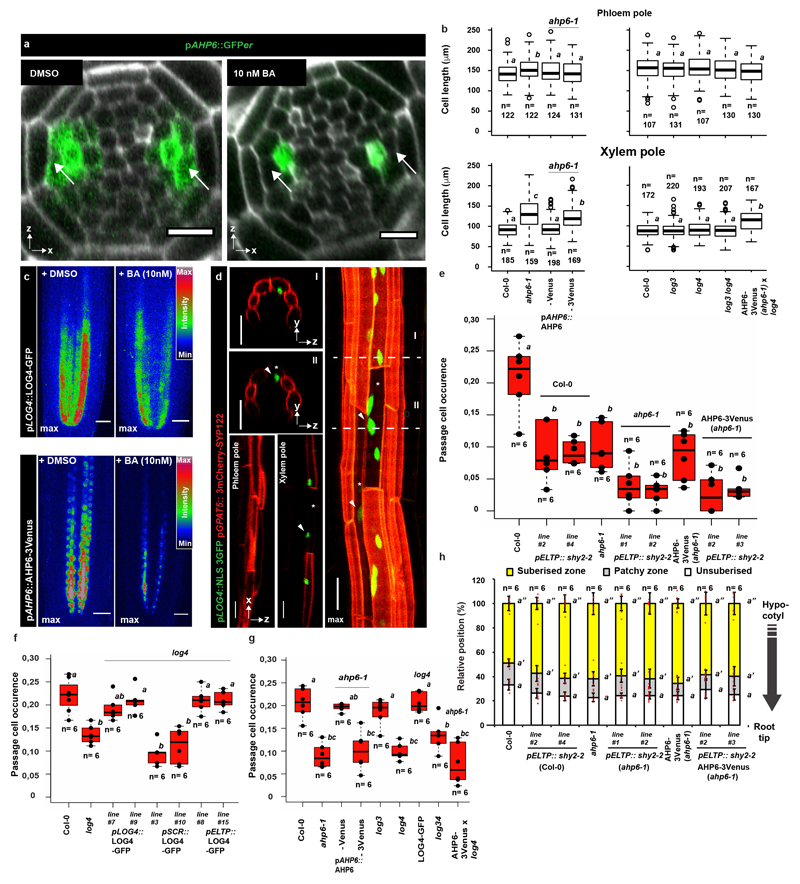
Extended Data Figure 7. Cytokinin-dependent formation of passage cells.
a) Expression of AHP6 visualized by an endoplasmic reticulum-localized GFP (GFPer)19 in the root apical meristem of plants grown either in presence of a mock treatment (DMSO) or 10 nM cytokinin (BA). Arrows point to xylem pole pericycle cells b) Length of suberised endodermal cells in the phloem and xylem poles of 5-day-old ahp6-1 and log mutants, complementing lines and stacked mutants grown on ½ MS plates. Data is partly overlapping with Figure 3. Open circles represent outliers. c) Expression of LOG4-GFP and AHP6-3Venus driven by their native promoters in the root apical meristem of plants grown either in presence of mock treatment (DMSO) or 10 nM cytokinin (BA) d) Expression of LOG4 in the suberised zone of 5-day-old seedlings visualized by the native LOG4 promoter driving expression of an NLS-3GFP construct. Suberised endodermal cells were highlighted by expression of the suberin biosynthetic marker pGPAT5::3mCherry-SYP122. e) Occurrence of passage cells in lines with inhibited AHP6 diffusion in combination with repressed auxin signaling (through expressing of shy2-2) in the differentiated endodermis. Dots represent individual datapoints. f) Passage cell occurrence in the log4 mutant complemented with a LOG4-GFP construct driven by either the native promotor (pLOG4), an early endodermis promoter (pSCR) or a differentiating endodermis promoter (pELTP). Dots represent individual datapoints. g) Occurrence of passage cells in the suberised zone of 5-day-old ahp6-1 and log mutants, ahp6 log doubles additionally complemented by non-mobile AHP6 in order to obtain endodermis-specific defects. Dots represent individual datapoints. h) Behavior of suberin in plants with or without inhibited auxin perception in the late endodermis grown on ½ MS plates. Red dots represent individual datapoints. Notice that for all stacked graphs there are 3 measurements per root (unsuberised zone (white), patchy zone (grey) and suberised zone (yellow)). Bar graphs represent mean ± SD, boxplot centers show median. Individual letters show significantly different groups according to a post hoc Bonferroni-adjusted paired two-sided T-test. For more information on data plots see the statistics and reproducibility section. Images in c) and d) represent 8 independent lines. All stainings were repeated 3 times. n represents independent biological samples. In b) n represents measurements across 16 biologically independent samples. For a) scale bars represent 10 μm. For all others 25 μm.

