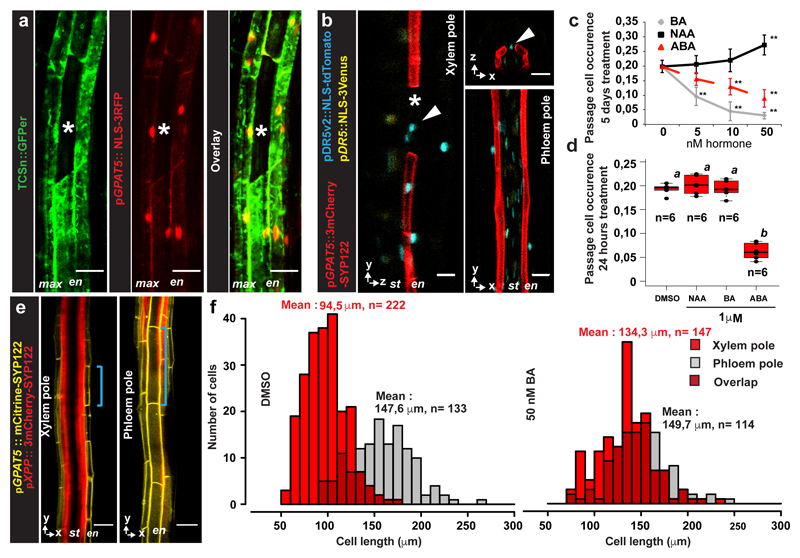
Figure 2. Cytokinin and auxin regulate endodermal patterning and passage cell formation.
a) Representative image depicting expression of cytokinin response marker TCSn (ER- GFP, green) or the suberin reporter GPAT5 (NLS-3mCherry, red) in fully suberised endodermis. b) Expression of auxin signaling reporter DR5v2 (NLS-tdTomato, blue), or DR5 (NLS-3mVenus, yellow) and suberin marker GPAT5 (3mCherry-SYP122, red) in fully suberised endodermis. Red dots represent individual data points. c-d) Occurrence of passage cells in seedlings germinated on indicated hormones c) or upon hormone incubation for 24 hours d) DMSO: mock treatment. Black dots represent individual data points. e) Optical sections through suberised endodermis. Suberin and xylem pole pericycle highlighted as in Fig. 1a. Blue lines highlight length of a single cell in xylem or phloem pole. f) Distribution of suberised endodermal cell length in xylem or phloem pole of plants germinated onmock (DMSO) or cytokinin plates. Numbers depict average lengths of xylem pole (red) or phloem pole (grey) endodermal cells. Asterisks indicate passage cells, arrowheads passage cell nuclei. ABA; Abscisic acid, BA; Benzyl adenine, DMSO; Dimethyl sulfoxide, En; Endodermis, NAA; Naphtalene acetic acid, nd; not detected, NLS; Nuclear localization signal, max; maximum projection, St; Stele. Boxplot centers show median. Individual letters show significantly different groups according to a post hoc Bonferroni-adjusted paired two-sided T-test. For a), b) and e) the image is representative of 8 independent lines. n represents independent biological samples. In c) ** Depicts significant difference (p<0,01) in a two-tailed T-test. Dots represent mean, error bars are SD, n = 25 independent biological replicas for each treatment. For more information on Data plots see the statistics and reproducibility section. For individual P values see supplementary table 2. Scale bars represent 25 μm.

