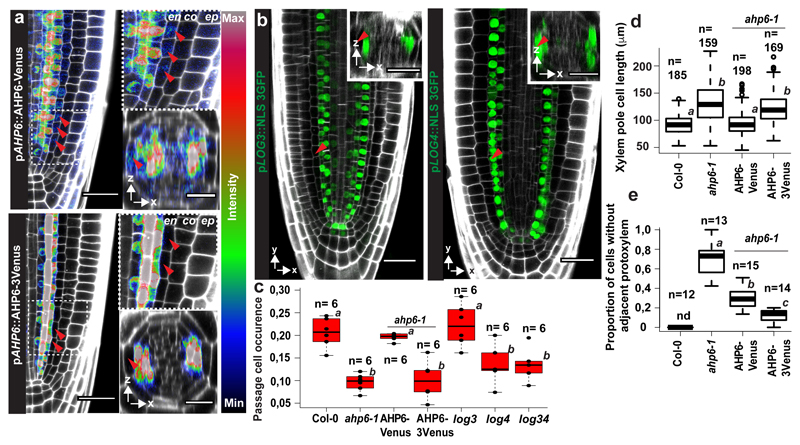
Figure 3. Spatially restricted cytokinin repression and production underlie passage cell formation.
a) Expression of pAHP6::AHP6-mVenus or pAHP6::AHP6-3mVenus from a previously published line19 in the root meristem. Figures represent longitudinal and transverse optical sections through the xylem pole of the root meristematic zone. b) pLOG3 and pLOG4 reporter activity (NLS-3GFP, green) in the root meristem. The used lines were previously published8 c) Occurrence of passage cells in ahp6-1 and lines complemented with AHP6 fused to a single or triple mVenus protein driven from AHP6 promoter. Dots represent individual data points. d) Length of xylem pole endodermal cells in suberised zone of ahp6-1 and lines complemented with AHP6 fusions. Dots represent outliers. e) Quantification of xylem defects in ahp6 mutant lines (for details, see Material and Methods). co; Cortex, en; Endodermis, ep; Epidermis, nd; Not detected, NLS; Nuclear Localization Signal. Red arrowheads indicate xylem pole endodermal cells. Boxplot centers show the median. Individual letters show significantly different groups according to a post hoc Bonferroni-adjusted paired two-sided T-test. For more information on data plots see the statistics and reproducibility section. For a) and b) the images are representative of previously published lines8,19. n represents independent biological samples. In d) n represents individual measurements across 16 independent biological samples. For individual P values see supplementary table 2. Scale bars represent 25 μm.

