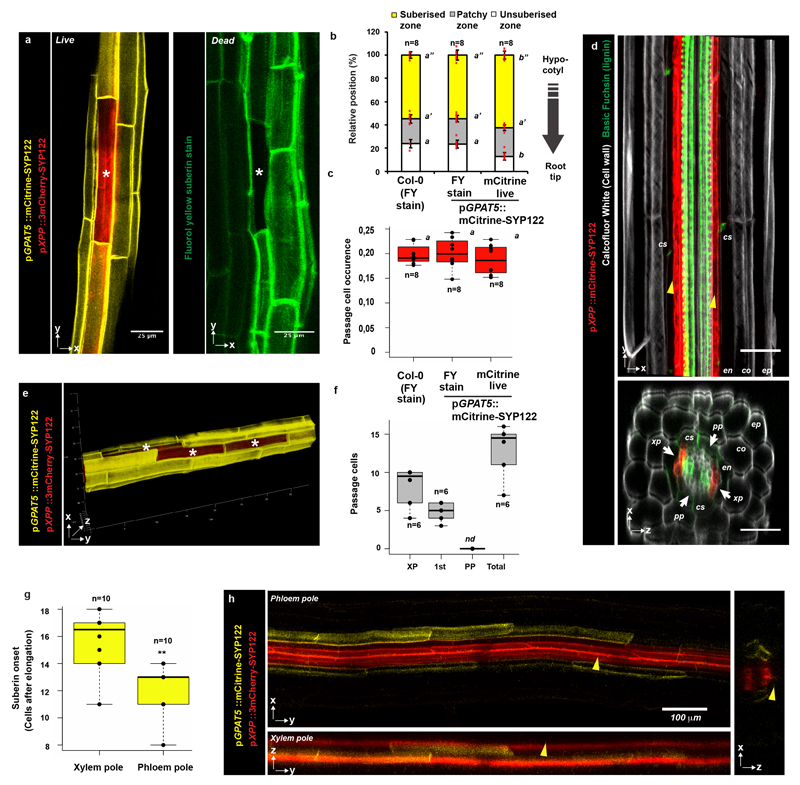
Extended Data Figure 1. Passage cells and suberisation in Arabidopsis.
a) A single xylem pole-associated passage cell surrounded by suberised cells as visualized in live imaging by expression of the suberin biosynthetic gene GPAT5 driving expression of a plasma membrane localized mCitrine reporter (mCitrine-SYP122) (yellow, left panel) or by the suberin-specific dye fluorol yellow (green, right panel). In the left panel, the xylem pole pericycle is highlighted using the promoter pXPP driving a 3mCherry reporter fused to the plasma membrane localized SYP122 (3mCherry-SYP122). Note that Fluorol Yellow protocol, which requires heating (70°C) of the sample and is incompatible with fluorescent protein detection. b) Comparison of endodermal suberisation in Col-0 and plants expressing the GPAT5-based reporter determined either by the suberin-specific dye Fluorol Yellow (FY) or live mCitrine expression, respectively. Red dots represent individual data points. c) Comparison of passage cell occurrence in Col-0 and plants expressing the GPAT5-based reporter determined either by the suberin-specific dye Fluorol Yellow (FY) or live mCitrine expression. Dots represent individual data points d) Expression of a plasma membrane localized mCitrine-SYP122 marker (red) driven by the xylem pole-specific promoter pXPP in the zone of protoxylem onset. Roots were cleared using ClearSee and stained with Basic Fuchsin (green) and Calcofluor White (grey)33. e) Radial- and longitudinally connected passage cells in the xylem pole of the suberised zone. f) Direct quantification of passage cells residing directly above xylem pole (XP), first side cell to the xylem pole (1st) or phloem pole (PP) in 5-day-old Col-0 plants. Dots represent individual datapoints. g) Quantification of the onset of endodermal suberisation in the phloem and xylem poles of roots expressing markers as in a). Dots represent individual data points. h) Representative images of the patchy zone of endodermal suberisation in the phloem and xylem poles of roots used for quantification in f). Yellow arrowheads indicate the xylem pole. co; cortex, cs; Casperian strip, en; endodermis, ep; epidermis, FY; fluorol yellow, pp; phloem pole, xp; xylem pole. Individual letters highlight significant differences between groups. Notice that for all stacked graphs there are 3 measurements per root (unsuberised zone (white), patchy zone (grey) and suberised zone (yellow)). Bar graphs represent mean ± SD, boxplots show median. Individual letters show significantly different groups according to a post hoc Bonferroni-adjusted paired two-sided T-test. For more information on data plots see the statistics and reproducibility section. a) and e) represent 5 independent lines, all stainings were repeated 3 times. n represents independent biological samples. ** Depicts significant difference in a two-tailed T-test. For individual P values see supplementary table 2. Scale bars represent 25 μm unless otherwise mentioned.

