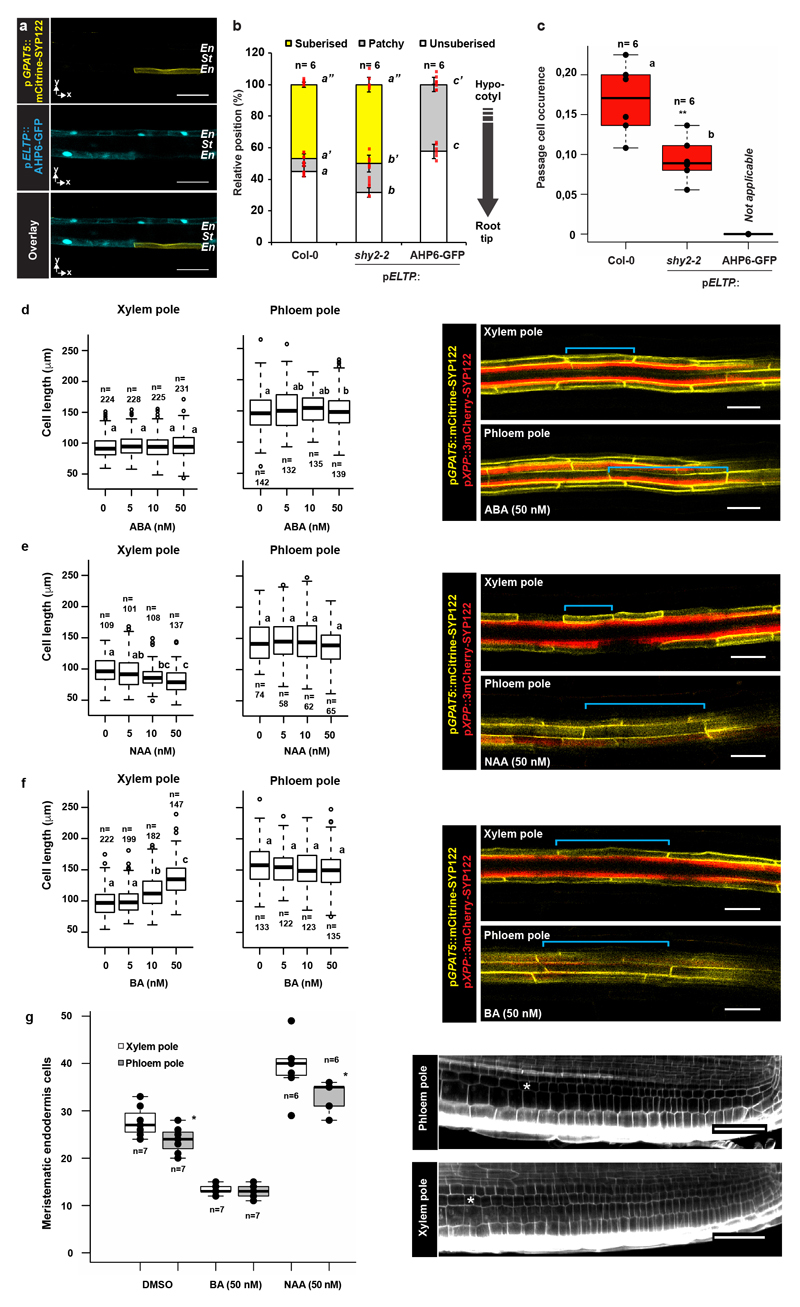
Extended Data Figure 4. Hormone-induced changes in endodermal cell lengths.
a) Expression of mCitrine-SYP122 driven by the GPAT5 promoter (yellow) in the fully suberised zone in plants expressing the dominant cytokinin-signaling inhibitor AHP6 fused to GFP in the differentiated endodermis using the ELTP promoter (Blue). b) Endodermal suberisation in 5-day-old seedlings expressing AHP6-GFP or the dominant auxin signaling repressor shy2-2 in the differentiated endodermis. Red dots represent individual datapoints. c) Occurrence of passage cells in 5-day-old seedlings expressing AHP6-GFP or the auxin signaling repressor shy2-2 in the differentiated endodermis. Dots represent individual datapoints. d-f) Length of suberised endodermal cells measured in the suberised zone of plants expressing pGPAT5::mCitrine-SYP122 and pXPP::3mCherry-SYP122 constructs. Open circles represent outliers. Plants were grown for 5 days on ½ MS media containing depicted concentrations of d) Abscisic acid (ABA). e) Auxin, Naphtalene acetic acid (NAA). f) Cytokinin, Benzyladenine (BA). g) Amount of meritematic cells in the phloem and xylem pole endodermis was counted in cleared roots stained with Calcofluor White33 to highlight cell walls. Dots represent individual datapoints. Notice that for all stacked graphs there are 3 measurements per root (unsuberised zone (white), patchy zone (grey) and suberised zone (yellow)). Protoxylem or -phloem was used as a marker to identify the poles. Cells were counted from the QC to onset of elongation. Asterisks highlight the last cell of the division zone. Blue lines highlight length of an individual cell. Letters indicate significant differences between groups. Bar graphs represent mean ± SD, boxplot centers show median. Individual letters show significantly different groups according to a post hoc Bonferroni-adjusted paired two-sided T-test. For more information on data plots see the statistics and reproducibility section. In a) the image is representative of 12 independent lines. In g) all stainings were repeated 3 times. n represents number of measurements across 16 independent biological samples. ** Depicts significant difference (p< 0,01) in a two-tailed T-test. Scale bars represent 25 μm.

