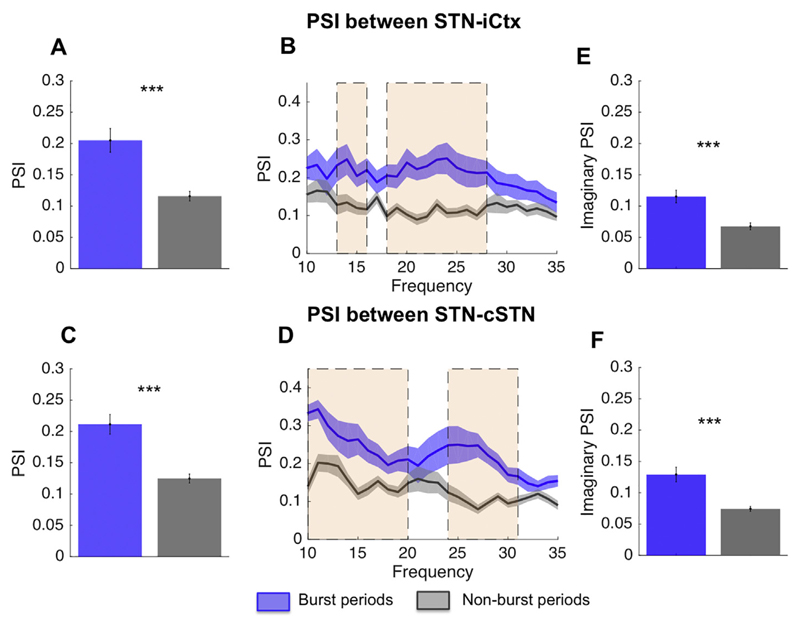
Fig. 5.
Phase synchrony index during and between bursts: PSI for burst periods (blue) and non-burst periods (grey) between STN and iCtx (A,B) and between STN and cSTN (C,D). Bursts defined using a 75th percentile amplitude threshold. For both pairs of sites, bursts show on average a greater PSI compared to non-burst periods (A: n = 17, p < .001 and C: n = 18, p < .001). In cluster-based permutation tests this proved significant (shaded areas) around 13–16 Hz and 18–27 Hz between STN and motor Ctx (A) and between 10 and 20 Hz and 24–31 Hz for the comparison between STN and cSTN (D). Over the frequency range of the significant clusters, phase locking was recalculated using the imaginary part of the signal (E, F) and differences remained significant for both comparisons (STN-iCtx n = 17, p < .001) and STN-cSTN n = 18, p < .001). Hence phase locking differences could not be simply ascribed to variations in volume conduction. Values presented as mean ± SEM. *** p < .001; STN = ipsilateral subthalamic nucleus, cSTN = contralateral subthalamic nucleus; iCtx = ipsilateral motor cortex. (For interpretation of the references to colour in this figure legend, the reader is referred to the web version of this article.)

