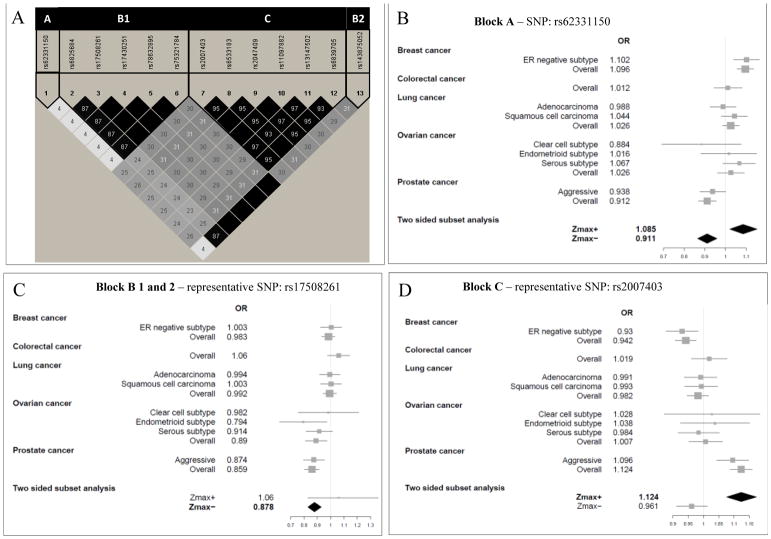
Figure 2.
(A) Linkage disequilibrium (LD) plot encompassing the significant SNPs in the TET2 region. Selected SNPs representing each LD block with respective forest plots are shown for (B) rs62331150 representing the single-variant block A; (C) rs17508261representing block B1 and B2; and (D) rs2007403 representing block C.

