
Figure 3.
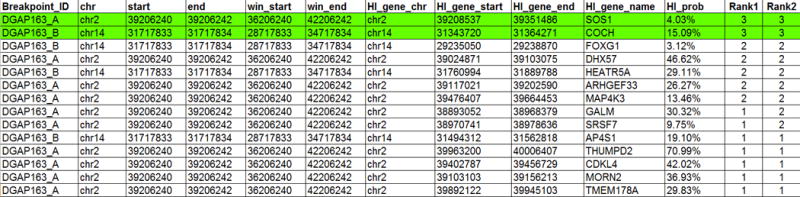
First 14 rows of the results file obtained in Step 9 of this protocol. Notice that several data columns were omitted in order to highlight the top candidate gene names and their ranking. The Rank1 column corresponds to the PERC+DHS+TAD+HAPLO+TRIPLO addition, while Rank2 represents the PERC+DHS+2Mb+HAPLO+TRIPLO sum. The best two candidates are highlighted in green. Notice how the top candidates have equal Rank1 and Rank2 values (3).