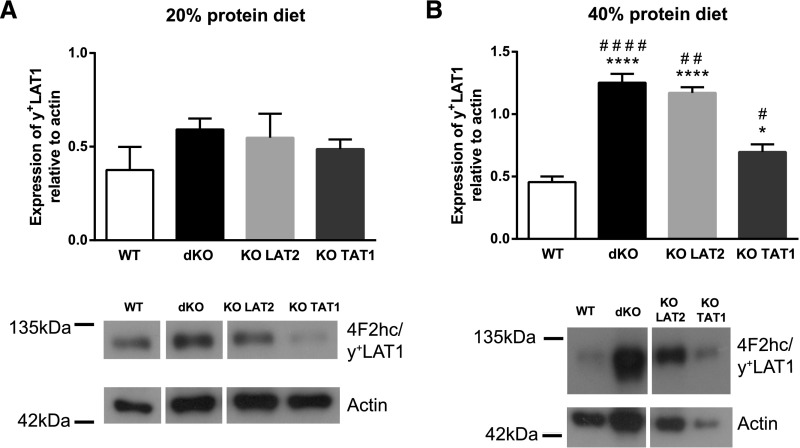
Figure 8.
y+LAT1 protein expression in kidney is upregulated upon ablation of LAT2 and TAT1 in mice under high protein diet. Expression was quantified in kidneys from homozygous male mice for the indicated genotypes and under diet with (A) 20% or (B) 40% protein content. y+LAT1 protein expression relative to actin as reference protein (upper panels) and a representative image of the immunoblots (lower panels) are shown for all genotypes in (A) and (B). Kidney total membranes (50 μg protein) were run in 10% acrylamide gels in nonreducing conditions. In these conditions, y+LAT1 band corresponds to y+LAT1/CD98hc heterodimer. Data (mean±SEM) are from 5–6 mice per group at 3–4 months of age and after 11 days with the indicated experimental diet. Statistical significance (t tests) is shown with * to indicate differences compared with wild-type and # to indicate differences versus same genotype in 20% protein diet (one symbol P≤0.05; two symbols P≤0.01; three symbols P≤0.001; and four symbols P<0.001). WT, wild-type.

