Figure 5.
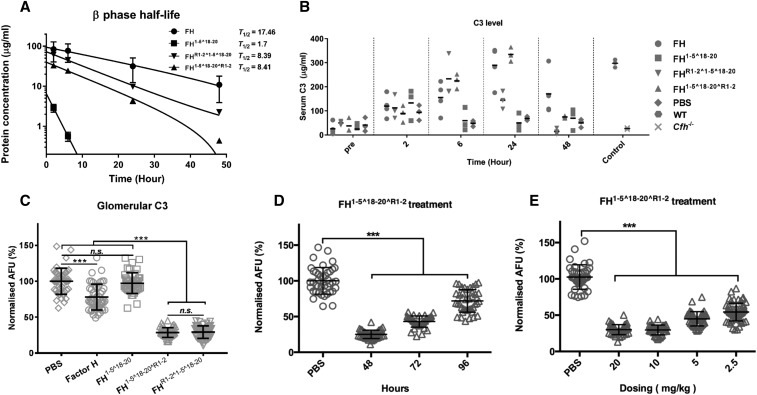
HDM-FH is highly effective in restoring intact C3 levels and reducing glomerular C3 deposits. Mice were dosed with 3 nmol plasma purified FH (●), FH1–5^18–20 (▪), FHR1–2^1–5^18–20 (▼), and FH1–5^18–20^R1–2 (▲). (A) FH and its derivatives were detected in plasma collected at various intervals postinjection using an OX-24 and goat–anti-FH polyclonal-based ELISA. OD readings were converted to micrograms per milliliter. The data were fitted into natural log decay curves, plotted in log scale against time. (B) Plasma C3 levels were detected using mAb 11H9 to capture and a polyclonal anti-C3 to detect. OD450 readings were converted to micrograms per milliliter using purified mouse C3 as standard. (C) Quantitative analysis of glomerular C3 immunofluorescence intensity at 48 hours after a single injection of plasma purified human FH, FH1–5^18–20, FHR1–2^1–5^18–20, FH1–5^18–20^R1–2, or PBS. (D) Quantified glomerular C3 immunofluorescence intensities at 48, 72, or 96 hours after a single injection of FH1–5^18–20^R1–2 were compared with mice treated with PBS. (E) Glomerular C3 immunofluorescence intensities after a single injection of 20–2.5 mg/kg (approximately 3–0.375 nmol) FH1–5^18–20^R1–2 were compared with that treated with PBS at 48 hours. For (C–E), for every condition >40 glomeruli at ×10 magnification from three mice were analyzed by ImageJ.46 In (A), the mean and SD for each measurement were calculated for all data points; natural log exponential decay curves were used to calculate T1/2 using GraphPad Prism. In (B), data are shown in a scatter dot plot; the black bar indicates the mean of each dataset. For (C–E), unpaired t test was performed as indicated. ***P<0.001; n.s., P>0.05. AFU, arbitrary fluorescent units; PBS, phosphate buffered saline; WT, wild-type.

