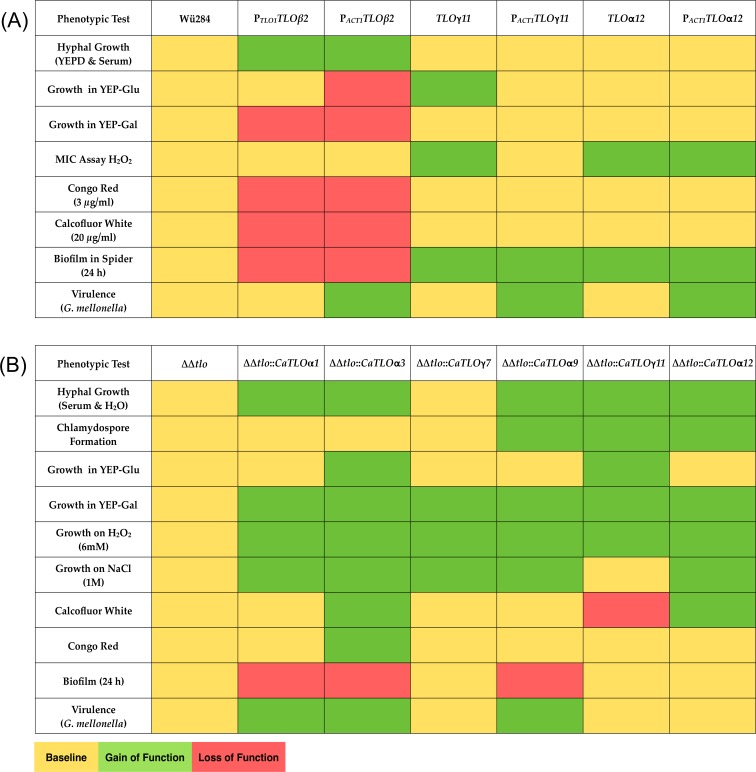
Fig 11. Heat maps summarizing phenotypic effects of CaTLO genes.
The phenotypic effects of expressing each CaTLO gene in the C. dubliniensis wild-type (panel A) and in C. dubliniensis ΔΔtlo (panel B) are colour coded; yellow indicates the same phenotype as the mutant, green indicates a gain of function and red indicates a loss of function.

