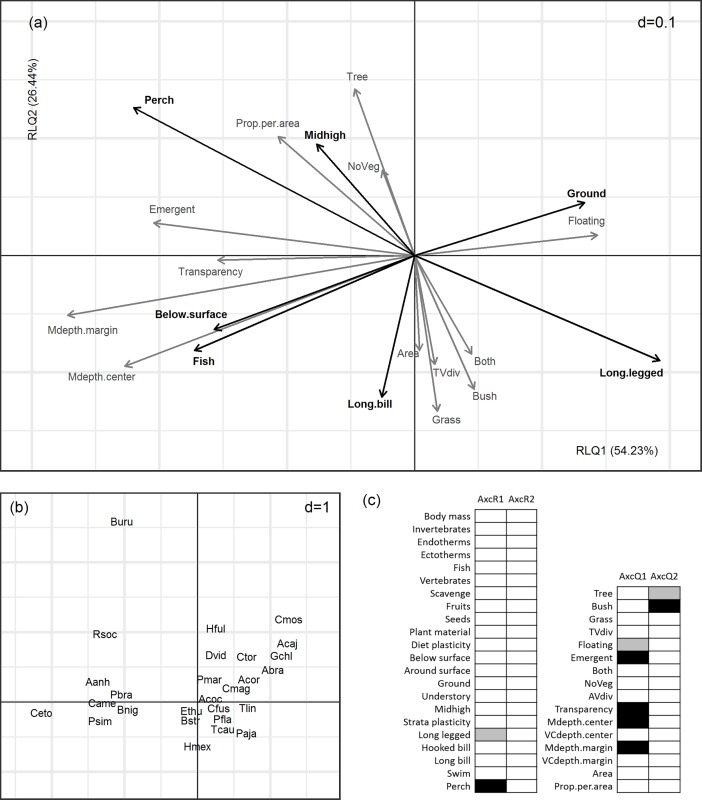
Fig 2. RLQ multivariate analysis.
Axes and scale are the same in figures (a) and (b), which represent projections in the plane of the first two main components of: (a) environmental variables and species traits; and (b) waterbird species. Only environmental variables and traits with correlations above 0.6 with at least one of the RLQ axes are represented. Environmental variables are represented in grey and traits in black. See Tables 1 and 2 and S1 Table for environmental variables, functional traits and species that correspond to abbreviations. Species names are centered on the corresponding points, and overlapped species have been removed to ease visualization. Values of d give the grid size. Results of the fourth-corner analysis are presented in (c), where grey and black filled squares represent negative and positive correlations respectively.

