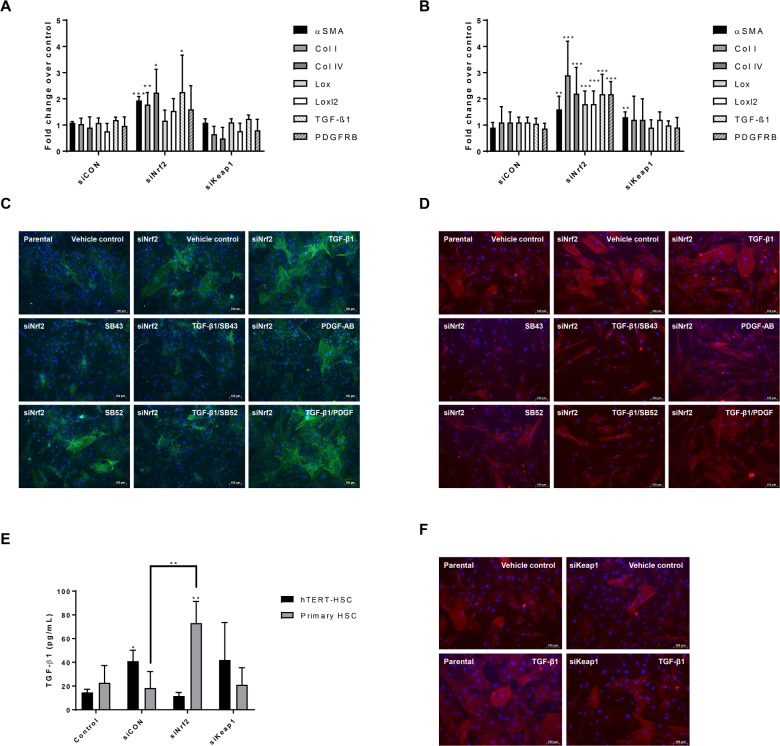
Fig 3. Effect of Nrf2 knockdown on HSC activation and response to stimuli.
(A-B) After 72 hours knockdown with siRNAs, mRNA was extracted from hTERT-HSC cells (A) and human primary HSCs (B). Fold change for each gene of interest was calculated as 2^(-ΔΔCT) for each sample and control and expressed as mean fold change ± SD. Beta-2-microglobulin (B2M) was used as reference gene for each sample. *, P ≤ 0.05; **, P ≤ 0.01; ***, P ≤ 0.001 vs Control (mean ± SD, N = 4 from independent experiment for hTERT-HSC and N = 6 different batches for primary HSC). (C-D) hTERT-HSCs (C) and primary HSCs (D) were treated for 48 hours with TGF-β1 (1 ng/mL), SB431542 hydrate (SB43) (10 μM), SB-525334 (SB52) (1 μM) and/or PDGF-AB (5 ng/mL). After treatment, the cells were fixed and stained against αSMA (green in C and red in D) and nuclei (DAPI, blue). The results show an increase in αSMA production in Nrf2 knockdown cells and a further increase after TGF-β1 exposure. SB43 and SB52 significantly inhibited the TGF-β1-induced αSMA. Pictures taken using fluorescence microscopy. siNrf2: Nrf2 knockdown. Scale bar: 100 μm. (E) TGF-β1 release was measured in supernatant medium in both transfected hTERT and primary HSCs by ELISA. siCON: scrambled siRNA; siNrf2: Nrf2 knockdown; siKeap1: Keap1 knockdown. *, P ≤ 0.05; **, P ≤ 0.01 vs Control or siCON (mean ± SD, N = 4 from independent experiments for hTERT-HSC and N = 5 different batches for primary HSC). (F) Immunostaining of αSMA (red) and nuclei (DAPI, blue) in Keap1 knockdown primary HSCs. Knockdown cells show more resistance again TGF-β1 (1 ng/mL) induced activation compared to control cells. siKeap1: Keap1 knockdown.

