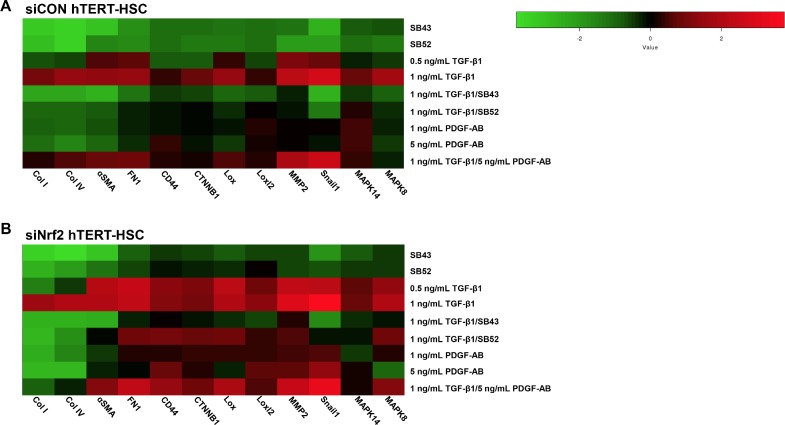
Fig 6. Heat map analysis of gene expression between control and Nrf2 knockdown hTERT-HSC.
Heat map analysis showing differential gene expression pattern in siCON transfected hTERT-HSC (A) and siNrf2 transfected hTERT-HSC (B) Heat map was generated on -Log2(ΔΔCT) by using the Heatmapper online software (http://www2.heatmapper.ca/expression/). Columns represent each gene of interest, while rows indicate each cell treatment. Cells were exposure to the tested compounds for 48 hours prior mRNA extraction.

