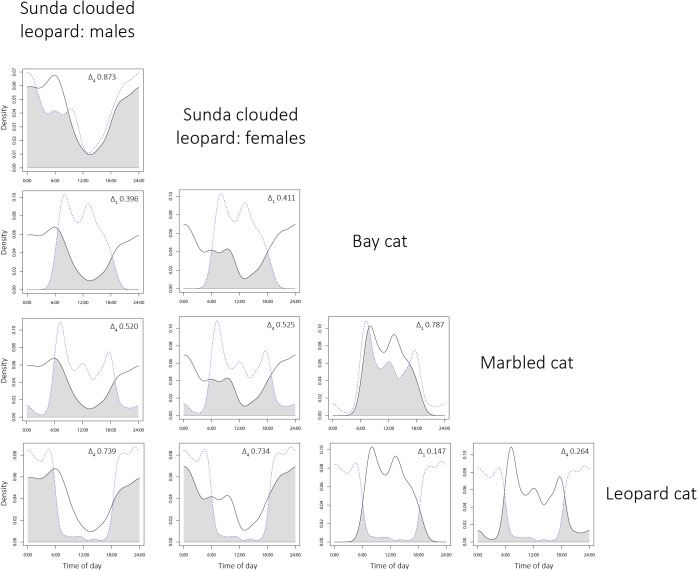
Fig 5. Overlaps of temporal activity patterns between Bornean wild cat species pairs, as estimated by kernel density estimates.
The species in each column and each row are represented by solid lines and blue dotted lines, respectively. The coefficient of overlap (Δ1 and Δ4) is shown by the grey shaded areas which represent the overlap periods.

