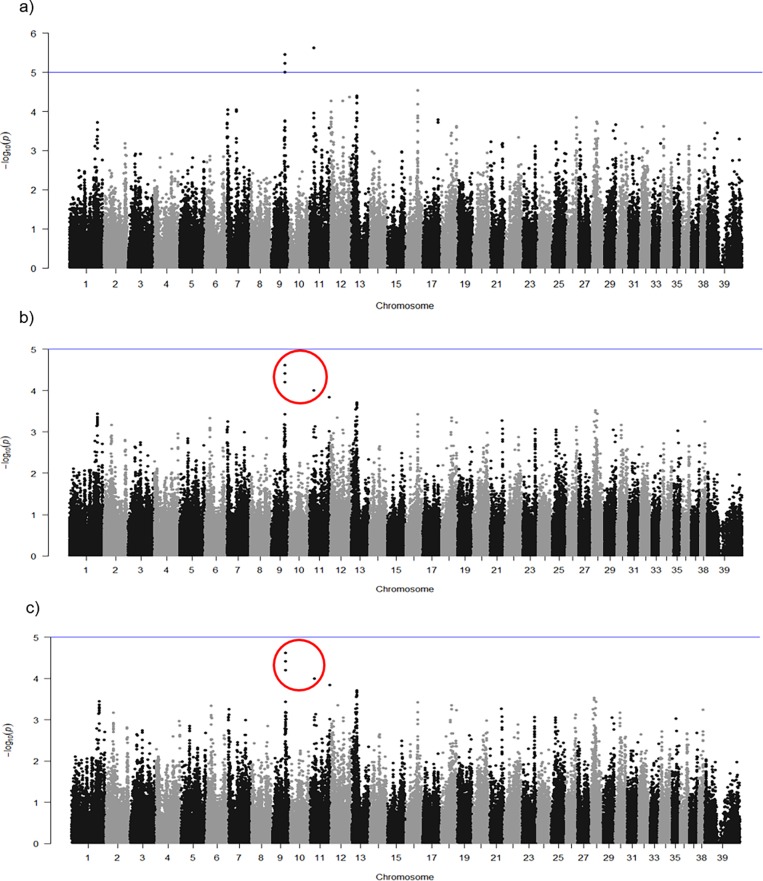
Fig 3.
Manhattan plots of basic case-control association test (a), logistic regression without covariate (b) and logistic regression with covariate (c). Suggestive association threshold is indicated with the blue line. SNPs of the logistic analyses with the lowest p-value that overlapped the basic association study are within red circles.

