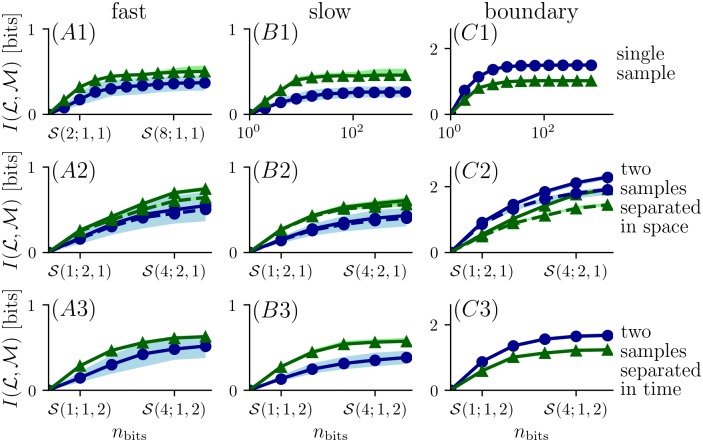
Fig 3. Mutual information between location () and measurement () for different encoding strategies.
The figure indices A, B and C correspond to the different flow conditions (fast flow, slow flow and boundary flow); the rows 1-3 compare different encoding strategies. In the first row the mutual information is calculated based on single samples taken at either the narrow grid (blue curves correspond to blue circles in Fig 1) or the wide grid (green curves correspond to green triangles in Fig 1). A2-C2: Coding schemes with increasing number of bits assigned to two sensors. Two samples separated in space were taken at a single time. Solid lines show information using knowledge of which sample occurs in which sensor; dashed line shows information ignoring which of two sensors measures which sample. A3-C3: Assigning bits to two temporal samples taken at the same location with a delay of 1.6 s. In all panels, bold curves correspond to estimates for the locations as given in Eq (2) and shaded regions correspond to information estimates for jittered locations (see Methods).

