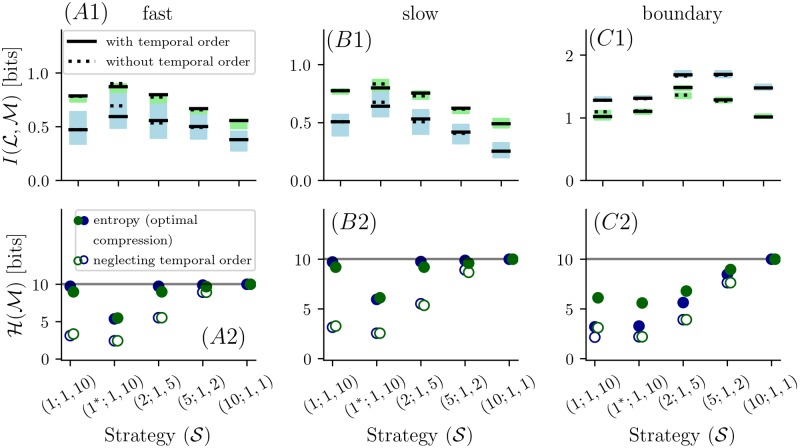
Fig 7. Top row shows the mutual information for different strategies of assigning ten bits into multiple consecutive samples for single sensors.
The black solid lines correspond to mutual information with knowledge of the temporal sequence in which samples occur. The dashed black lines correspond to mutual information where the temporal sequence is ignored. The blue and green shaded regions correspond to information for the jittered locations of the narrow- and wide grid. Second row (A2-C2) shows the entropy for the corresponding strategies. The gray lines indicate the entropy of the incompressible odor measurements (). Full blue and green circles represent the entropy of the measurements at the narrow and wide grid locations. Hollow circles correspond to the measured sequence where the temporal sequence is ignored.

