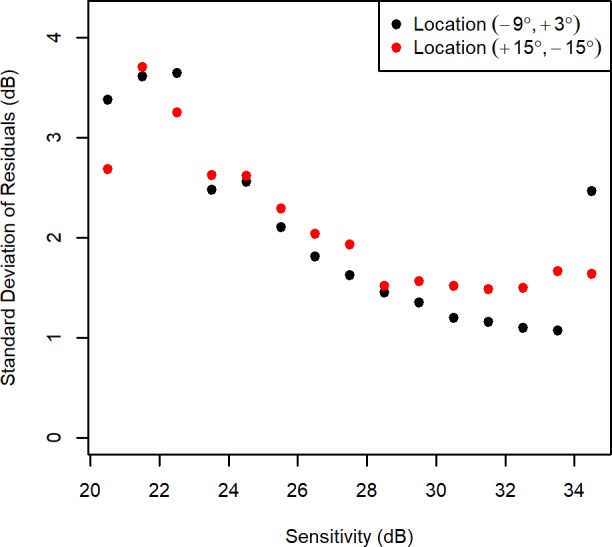
Figure 2.

The observed variability at two locations in the visual field, when the sensitivity fell within each 1-dB-wide bin. The y-axis shows the SD of residuals using a homoscedastic fixed-effects model, equivalent to the residuals from ordinary least squares linear fits for the longitudinal series at that particular location for each individual eye, with those residuals binned according to the fitted sensitivity on that test date.
