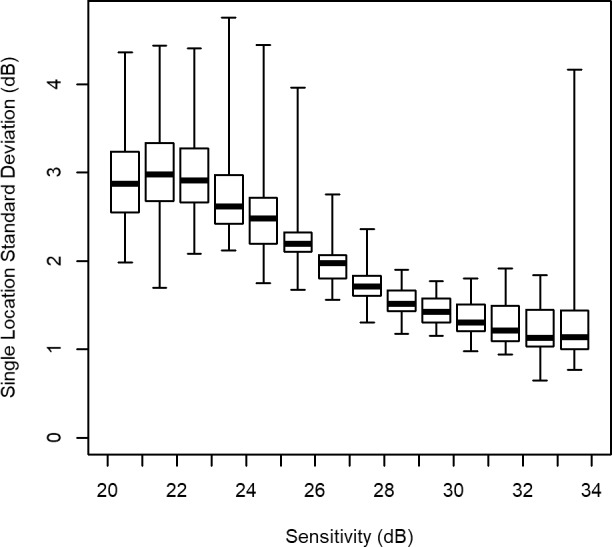
Figure 3.

Spatial homogeneity at different sensitivity levels. At each location in the visual field, the SD of residuals (using a homoscedastic fixed-effects model) was calculated among eyes whose predicted sensitivity fell within a 1-dB-wide bin on that test date. For each sensitivity level, the median of these individual-location SDs is shown by the thick horizontal line, the box shows the interquartile range, and the whiskers show the full range of values between locations. The width of the box (or alternatively the width of the whiskers) can thus be taken as a measure of spatial heterogeneity in the variability.
