Figure 2.
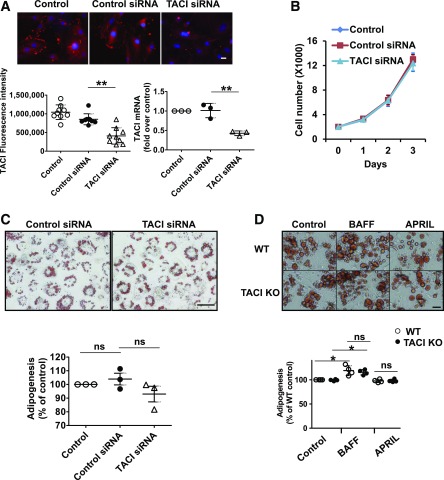
TACI is not required for adipogenesis. A: TACI expression in 3T3-L1 fibroblasts was determined by confocal microscope (scale bar = 20 µm) or real-time PCR 48 h after transfection of cells with control or TACI-specific siRNA. The samples were run in duplicates, and each experiment was repeated three times. Quantification of TACI (red) fluorescence intensity and mRNA levels were plotted. **P < 0.01. B: The proliferation of control or TACI-specific siRNA–transfected 3T3-L1 fibroblasts was quantified by counting the live cells after exclusion of the trypan blue–stained dead cells. The samples were run in triplicates, and each experiment was repeated three times. C: Control or TACI-specific siRNA–transfected 3T3-L1 cells were incubated with differentiation medium for 3 days and maintenance medium for another 3 days. Cells were fixed and lipid accumulation was monitored by Oil Red O staining. Images are presented at original magnification ×200 (scale bar = 100 µm). Lipid stains were extracted with isopropyl alcohol and quantified with spectrophotometry. Data were normalized to the mock control, and means ± SD of three experiments were plotted. D: Wild-type (WT) and TACI KO primary SAT-derived mesenchymal cells, isolated from groups of three mice, were incubated with differentiation medium for 3 days and maintenance medium for 3 more days with or without 100 ng/mL BAFF or APRIL. Cells were fixed and lipid accumulation was monitored by Oil Red O staining. Images are presented at original magnification ×200 (scale bar = 50 µm). Lipid stains were extracted with isopropyl alcohol and quantified with spectrophotometry. Data were normalized to the wild-type control, and the means ± SD of four experiments were plotted. ns, not significant. *P < 0.05.

