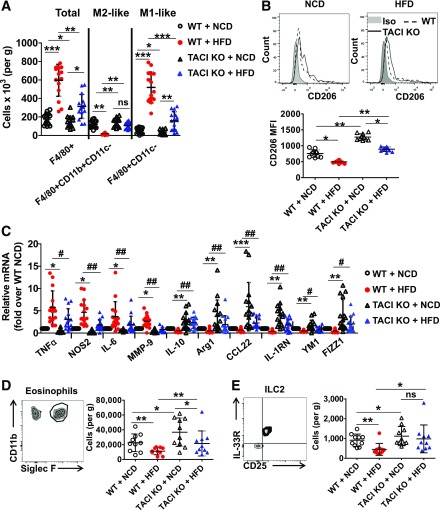
Figure 3.
Changes in TACI KO mouse AT cellular composition after HFD challenge reflect type 2 immune response. A: TACI KO and wild-type (WT) mouse SVF cells were isolated from perigonadal fat pad and analyzed by flow cytometry. Isolated cells were stained with F4/80, CD11b, and CD11c antibodies to enumerate M1-like and M2-like Mϕs. (See Supplementary Fig. 3B for gating strategy.) Data presented as mean ± SD of 15 mice. B: SVF cells were further purified by density centrifugation with 30 and 70% Percoll gradient, and Mϕs were positively collected using F4/80 antibodies and magnetic-activated cell sorting technology. CD206 expression on isolated Mϕs was measured by flow cytometry. Data presented as mean ± SD of 10 mice. C: Isolated Mϕs were also used to quantify the expression levels of M1- and M2-associated genes in real-time PCR. Data presented as mean ± SD of 15 mice per group. D: Perigonadal fat pad SVF cells were gated with CD11b and Siglec F antibodies to quantify eosinophil numbers. (See Supplementary Fig. 5B for gating strategy.) Data presented as mean ± SD of 10 mice. E: Antibodies against CD25, CD127, and IL-33R molecules were used to quantify ILC2 cells. (See Supplementary Fig. 5C for detailed gating strategy.) Data presented as mean ± SD of 10 mice. Quantification of Mϕs, eosinophils, and ILC2 was shown as cell numbers of fluorophore-positive cells in 1 g of VAT tissue. Iso, isotype; MFI, mean fluorescence intensity; ns, not significant. *P < 0.05, **P < 0.01, and ***P < 0.001. #P < 0.05 and ##P < 0.01.

