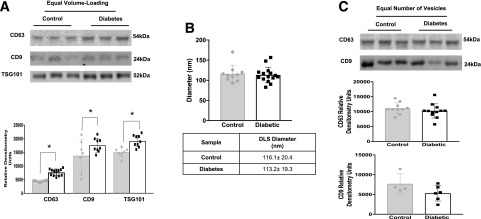
Figure 2.
A: Western blot of plasma exosomes isolated through the use of ExoQuick from control and STZ-induced diabetic (3 months) mice (top). Under conditions of equal volume, increased amounts of exosomal markers (CD63, CD9, and TSG101) were measured in diabetic mouse plasma (bottom). The markers were quantified on the basis of average band intensity (n = 9, 8, and 7 for the three control measurements (gray bars, gray circles, left to right), and n = 15, 9, and 9 for diabetes measurements (white bars, black squares, left to right). *P < 0.05. B: DLS (nanometer) readings of mouse plasma exosomes showed no change in exosome diameter between control mice (n = 10; gray bars, gray circles) and diabetic mice (n = 15; white bars, black squares). C: Western blot of plasma exosomes isolated with ExoQuick from control and STZ-induced diabetic (3 months) mice. Under loading conditions with an equal number of vesicles, no change in plasma exosomes (CD63 and CD9) was observed between control mice (gray bars, gray circles) and diabetic mice (white bars, black squares). Exosomes were quantified on the basis of average band intensity (n = 10 [middle] and 4 [bottom] for control and n = 12 [middle] and 6 [bottom] for diabetes). All data points are shown as univariate scatter plots with mean and SD.

