Figure 7.
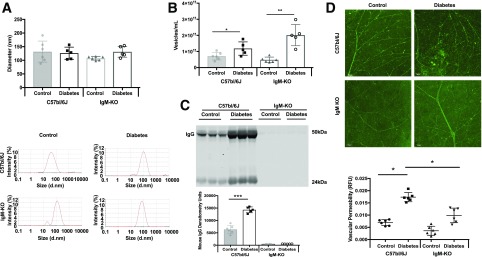
Analysis of plasma exosomes, isolated with ExoQuick, from control and STZ-induced diabetic (7 weeks) C57BL/6J and IgM-KO mice. A: DLS measurements showed no difference in the diameter of plasma exosomes from C57bl/6J and IgM-KO control (gray bar, gray circles, and white bar, black squares, respectively) or C57bl/6J or IgM-KO diabetic mice (white bar, gray triangles and white bar, white circles, respectively). B: The number of plasma exosomes was increased significantly in both C57bl/6J and IgM-KO diabetic mice compared to control (symbols as in A) . Exosomes were isolated with ExoQuick from plasma from control (n = 6) and STZ-induced diabetic (n = 5) mice and measured by using SLS (kilocounts per second). *P < 0.05; **P < 0.01. C: Western blot of ExoQuick-isolated mouse plasma exosomes (top). Under loading conditions of equal volume, more diabetic C57bl/6J plasma exosomes contained IgG (white bar) than control plasma exosomes (gray bar) (bottom). No IgG expression was measured within IgM-KO control or diabetic plasma exosomes. ***P < 0.001. D: Retinal permeability was examined in control and diabetic C57bl/6J and IgM-KO mice (7 weeks control and diabetes; n = 6). Diabetic C57bl/6J retinas showed more vascular permeability than control retinas (top), but retinal vascular permeability in IgM-KO mice did not significantly change between the control and diabetes states (bottom). Retinal fluorescence intensity is quantified through the use of fluorescein isothiocyanate–albumin, as shown in the graph at the bottom (control, n = 6; diabetes, n = 5; black circles = C57bl/6J control, black squares = C57bl/6J diabetic; black triangles = IgM-KO control; black inverted triangles = IgM-KO diabetic). Scale bars = 50 μm. All data points are presented as univariate scatter plots with mean and SD. d.nm., diameter, in nanometers; RFU, relative fluorescent unit.

